Herrick Payoff Index: Understanding Derivative Market Trends
The Herrick Payoff Index is a forward-looking technical analysis tool used to identify trends in derivative markets. Using price, volume, and open interest, the index provides an overview of money flow in the derivative markets, which investors can use as an indication of bullish or bearish trendsBullish and BearishProfessionals in corporate finance regularly refer to markets as being bullish and bearish based on positive or negative price movements. A bear market is typically considered to exist when there has been a price decline of 20% or more from the peak, and a bull market is considered to be a 20% recovery from a market bottom.. Open interest is the number of outstanding derivative contracts that are still open at the end of the trading day.
Summary
- The Herrick Payoff Index is a forward-looking technical analysis tool. The index uses price, volume, and open interest to find trends and reversals.
- The index offers four situations – bullish continuation, bullish reversal, bearish continuation, and bearish reversal.
- The benefit of the Herrick Payoff Index is its forward-looking capacity to predict trends, as well as its ability to distinguish between short rallies and significant trends. The downside is that it can produce false signals, which can cause investors to incur losses.
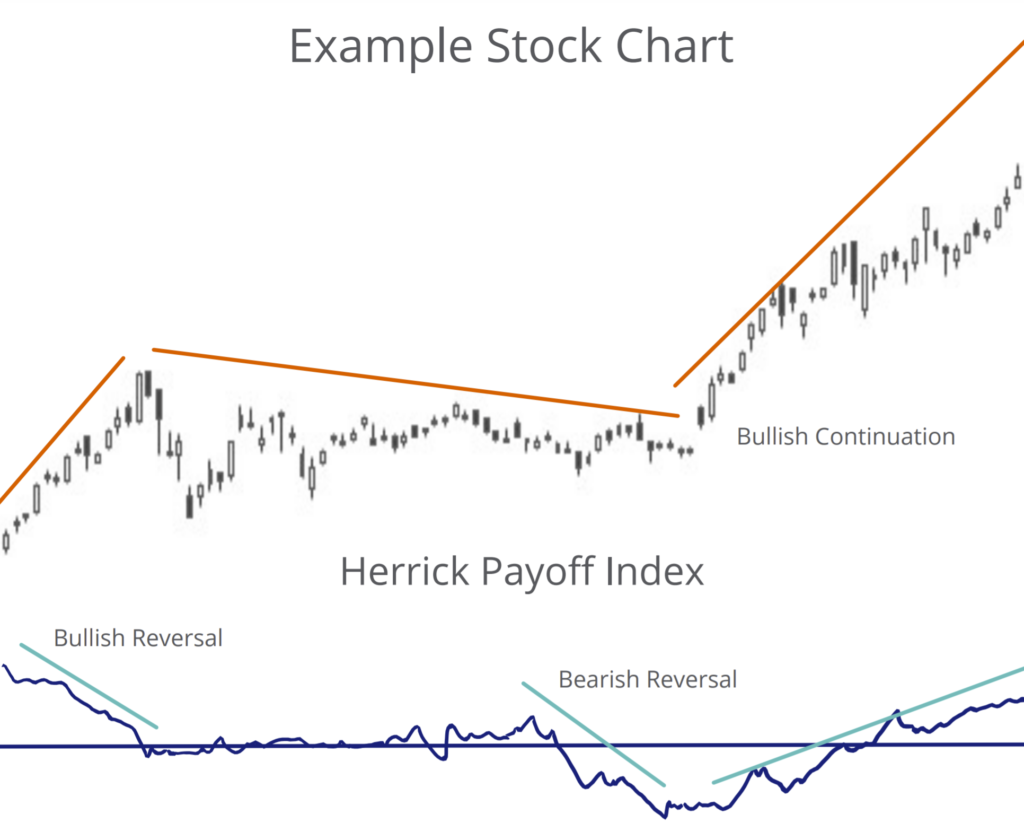
How to Interpret the Herrick Payoff Index
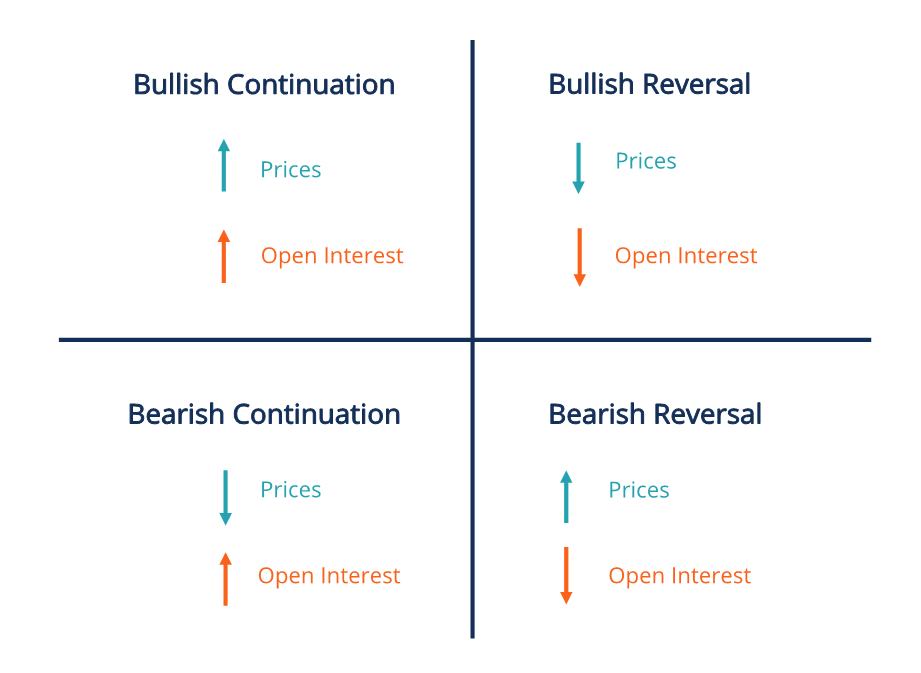
To interpret the index, investors must compare the trends of price and index. There are four possible situations:
1. Bullish Continuation (rising prices and open interest)
The bullish continuation situation is characterized by rising prices and open interest, confirming the upwards trend of the derivativeDerivativesDerivatives are financial contracts whose value is linked to the value of an underlying asset. They are complex financial instruments that are.
2. Bullish Reversal (falling prices and open interest)
The bullish reversal situation consists of both falling prices and open interest, signaling a decrease in selling pressure and, therefore, a potential rise in price in the future.
3. Bearish Continuation (falling prices and rising open interest)
The bearish continuation situation is a result of the divergenceDivergenceDivergence is when the asset price moves in the direction opposite to what a technical indicator indicates. When a stock is diverging, it between price and open interest. Prices are falling while the open interest is rising, meaning that investors are continuing selling off the derivative and thus reaffirming that prices will continue to fall.
4. Bearish Reversal (rising prices and falling open interest)
The bearish reversal situation sees a divergence between price and open interest; while prices are rising, the open interest is actually falling. It signals that bullish investors are buying in at a lower rate, perhaps resulting in prices falling in the near future.
When the index rises above zero, money is flowing into the market – a bullish outlook. Conversely, when the index falls to zero, money is flowing out of the market – a bearish outlook.
Benefits of the Herrick Payoff Index
Because the Herrick Payoff Index is a forward-looking indicator, it predicts trends that can be beneficial for investors looking ahead to make decisions. Investors can use the signals to sell their derivatives before the price drops or buy into the derivative just before prices rise. This is in contrast to many popular lagging indicators, such as moving averagesMoving AverageA moving average is a technical indicator that market analysts and investors may use to determine the direction of a trend. It sums up the data points, which use historical data to confirm long-term trends.
Another benefit of the indicator is its ability to distinguish between short rallies and significant trends. When the index is far above or below 0, it indicates a long-term trend. On the other hand, if the index hovers around 0, the trend is predicted to be short-lived.
Downsides of the Herrick Payoff Index
Just as any indicator, the Herrick Payoff Index cannot always accurately predict the future. With that said, the biggest downside with the index is that false signals can result in investors losing out.
For example, investors may choose to sell their assets because the index suggests that the upwards trend of prices may see a reversal in the near future. If the reversal does not materialize, the investor may feel regret for selling too early and not realizing the potential gains due to their decision to sell.
Conversely, investors may buy into derivatives thinking there will be a bull reversal coming up when in reality, the price just keeps falling. The best way to mitigate the false signal risk is by using the Herrick Payoff Index in conjunction with other indicators.
Additional Resources
CFI is the official provider of the global Capital Markets & Securities Analyst (CMSA)®Program Page - CMSAEnroll in CFI's CMSA® program and become a certified Capital Markets &Securities Analyst. Advance your career with our certification programs and courses. certification program, designed to help anyone become a world-class financial analyst. To keep advancing your career, the additional CFI resources below will be useful:
- Advanced Technical AnalysisAdvanced Technical AnalysisAdvanced technical analysis usually involves using either multiple technical indicators or a rather sophisticated (i.e., complex) indicator. "Sophisticated"
- Equity DerivativesEquity DerivativesEquity derivatives are financial products/instruments whose value is derived from the increase or decrease in the underlying assets.
- Financial MarketsFinancial MarketsFinancial markets, from the name itself, are a type of marketplace that provides an avenue for the sale and purchase of assets such as bonds, stocks, foreign exchange, and derivatives. Often, they are called by different names, including "Wall Street" and "capital market," but all of them still mean one and the same thing.
- Momentum IndicatorsMomentum IndicatorsMomentum indicators are tools utilized by traders to get a better understanding of the speed or rate at which the price of a security changes. Momentum
-
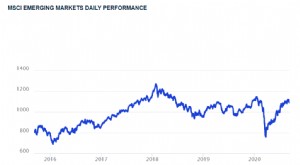
MSCI Emerging Markets Index: Definition & Key Facts
The MSCI Emerging Markets Index is used to measure the stock market performance within emerging countries. Established in the 1960s, It is one of many indexes created by Morgan Stanley Capital Interna
-
Negative Volume Index (NVI): A Comprehensive Guide
The Negative Volume Index (NVI) is a technical indicator used to identify trends in a market. It is a cumulative indicator, which means that all changes to the indicator accumulate. Put another way, t
invest
- Advance-Decline Line: Understanding Market Sentiment & Trends
- Arms Index (TRIN): Understanding Short-Term Market Sentiment
- DAX Index: Your Guide to Germany's Top 30 Companies
- EAFE Index: Understanding Developed Market Performance
- KBW Bank Index: Tracking US Banking Sector Performance
- NASDAQ-100 Index: Definition, Components & Historical Data
- Nikkei Index: Understanding Japan's Top Stock Market Indicator
- Price-Weighted Index Explained: How It Works & Examples
- Understanding the S&P 500: Top Holdings & Long-Term Performance
-
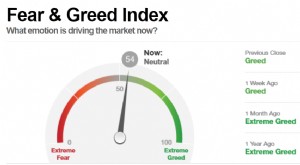 Fear & Greed Index: Understanding Investor Sentiment | CNN Business
The Fear and Greed Index, developed by CNNMoney, is used to gauge whether investors are too bullish or bearish on the stock market. The index ranges from 0 (extreme fear) to 100 (extreme greed). ...
-
 Hang Seng Index (HSI): A Comprehensive Guide to Hong Kong's Stock Market
The Hang Seng Index (HSI) is a stock market index in Hong Kong. It records and monitors the daily changes in stock prices of the 50 largest Hong Kong stock market companies. As the companies represent...