Bullish Engulfing Pattern: Meaning, How to Identify & Trade
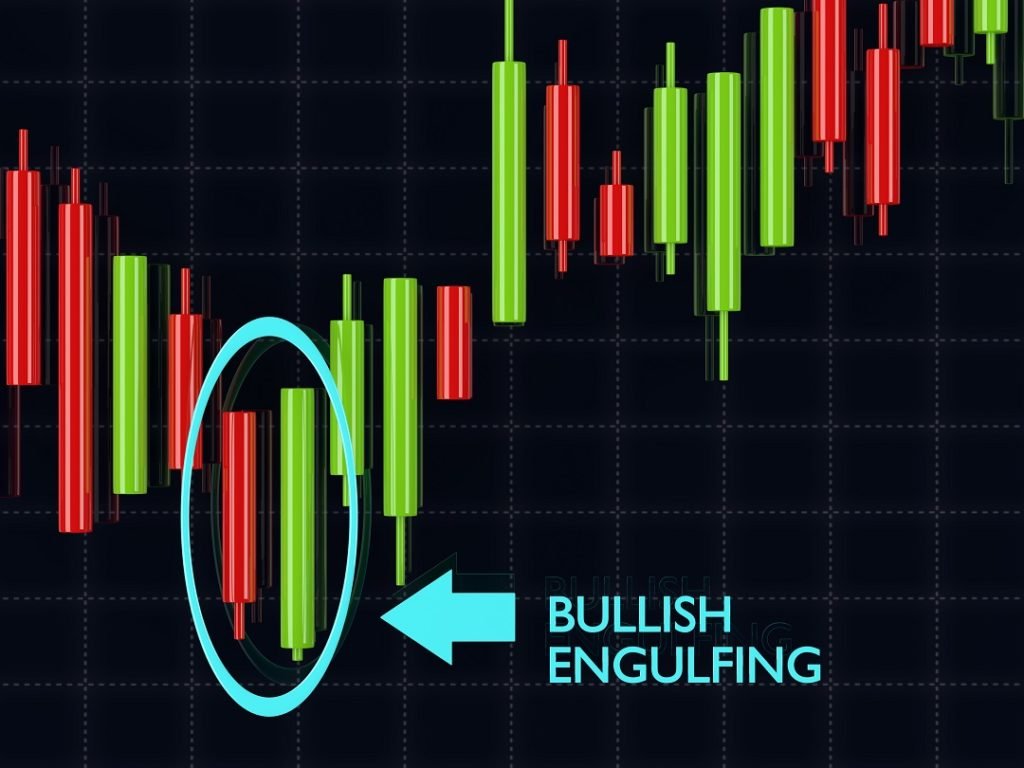
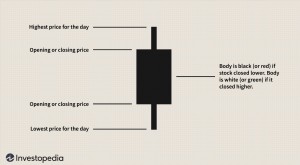
A bullish engulfing candlestick shows a pattern of trading prices for a particular security, indicating a reversal in price trends. A candlestick is a type of chart that represents the four important prices for intraday trading: opening, closing, day’s high and day’s low, for any security.
Summary
- A bullish candlestick pattern shows a reversal in the trend of stock prices, from a downward to an upward trend.
- In the phenomenon, a red candlestick showing a downtrend is completely engulfed by a larger green candlestick showing an uptrend on the next day.
- The bullish engulfing candle encourages traders to assume a long position; that is, they should buy the stock and hold on to it, with the intention of selling it in the future at a higher price.
Understanding Bullish Engulfing Candlesticks
When a security closes at a higher price than that at which it opens, the body of the candlestick is colored in green, or left hollow, and is called a green or a hollow candlestick. On the other hand, when the closing price is less than the opening price, the candlestick is colored in red, or black, and is called a red or a black candlestick.
A red candlestick indicates a downward trend in prices and represents a bearishBullish and BearishProfessionals in corporate finance regularly refer to markets as being bullish and bearish based on positive or negative price movements. A bear market is typically considered to exist when there has been a price decline of 20% or more from the peak, and a bull market is considered to be a 20% recovery from a market bottom. phase in the market. Sometimes, a red candlestick is followed by a green one, such that the opening price on the second day is lower than the closing price on the first, and the close on the second day is higher than where it opened on the first.
Graphically, the green candlestick is seen to engulf the red one. It is a bullish engulfing candlestick pattern.
Bullish Engulfing Candlestick Example
Consider the prices of Stock XYZ on two consecutive days, which are as follows:
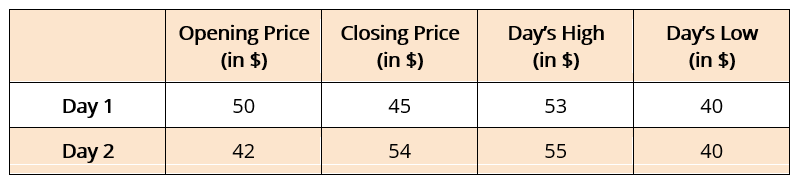
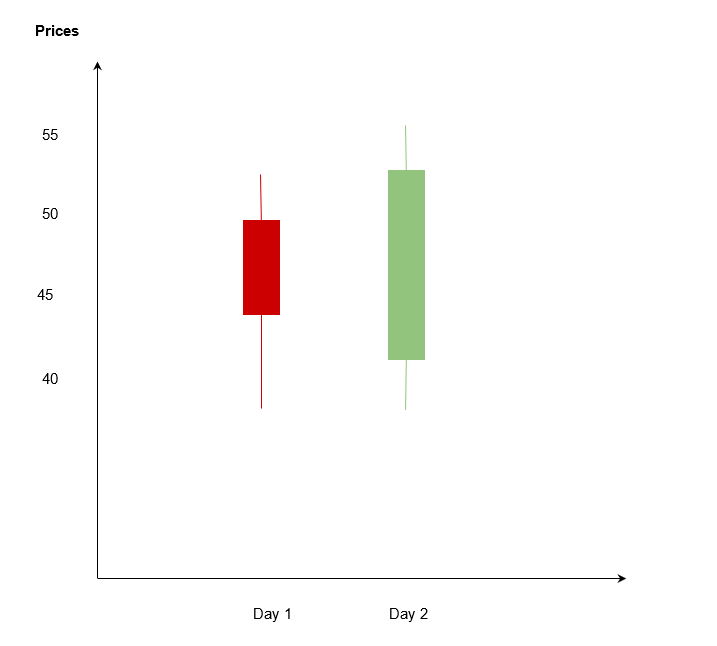
The candlestick graph for the stock will look as follows:
The pattern signifies a change or a reversal in the ongoing trend of the prices of a particular security. Generally, the bullish engulfing candle is preceded by more red candles, representing a bearish phase in the market. In fact, the bullish engulfing candle usually represents the bottom of a downward trend in prices, after which the prices begin to show an uptrend.
In such a situation, investors are initially pessimistic about the market during the downtrend, and try to gain by selling their securities. Such investors are referred to as bears in stock market parlance.
When the downward trend in prices is followed by a green candle that engulfs the red one of the previous day, it is suggestive of a reversal in the price trends. It means that despite the presence of bears, there are some optimistic investors, or bullsBull vs BearThe term bull vs. bear denotes the ensuing trends in stock markets – whether they are appreciating or depreciating in value – and what is the, who continue to buy the stock and finally manage to raise its trading price.
Basically, the second day starts with a bearish market, but active buying by bullish investors drives up the closing price above the opening price. There is a reversal in the price pattern from a downward to an upward trend.
How Should Traders Respond?
The response of traders to a bullish engulfing candle depends on whether they’ve been holding a long or a short position in the market. Since the event is preceded by a downward trend in prices, most traders short the stock in the bearish phase.
Shorting refers to when the trader sells a particular stock at present, with the intention of making profits by repurchasing it at a lower price in the future. Traders assume a short position when they expect the price of a stock to fall in the future.
With a reversal in price trends, short traders need to change their strategies accordingly. The bullish engulfing candle encourages traders to assume a long position. It means that traders should buy the stock and hold on to it, with the intention of selling it in the future at a higher price.
Since stock prices are likely to increase further after the candle, it will be profitable for traders to buy the stock at present. In fact, traders can make the maximum gain when they buy at the lowest intraday price on the second day of the candle.
An upward trend in prices cannot always be guaranteed after a bullish engulfing candle. Sometimes, the difference between the opening and closing prices on the red candle is very less, making the body of the candle very narrow.
If the candle is engulfed by a green candle on the following day, it might not necessarily result in a trend reversal. It is because the closing price of the green candle can be marginally higher than the opening price, and still engulf the preceding narrow red candle.
In such a case, the volume of tradingVolume of TradeVolume of trade, also known as trading volume, refers to the quantity of shares or contracts that belong to a given security traded on a daily basis has not changed significantly; rather, the engulfing candle has been brought about by minor fluctuations in trading volumes. In order for prices to rise in the future consistently, there must be a considerable increase in the purchasing of the stock so that its closing price ends up much higher than the opening price.
In order to ensure a definite reversal in trends, some traders wait for a day before they decide to switch to a long position. The traders miss out on one day’s profits in exchange for the guarantee that the market trend has indeed changed.
Additional Resources
CFI offers the Commercial Banking & Credit Analyst (CBCA)™Program Page - CBCAGet CFI's CBCA™ certification and become a Commercial Banking & Credit Analyst. Enroll and advance your career with our certification programs and courses. certification program for those looking to take their careers to the next level. To keep learning and advancing your career, the following resources will be helpful:
- Advanced Technical AnalysisAdvanced Technical AnalysisAdvanced technical analysis usually involves using either multiple technical indicators or a rather sophisticated (i.e., complex) indicator. "Sophisticated"
- Japanese CandlestickJapanese CandlestickJapanese Candlesticks are a technical analysis tool that traders use to chart and analyze the price movement of securities. The concept of candlestick charting was developed by Munehisa Homma, a Japanese rice trader.
- Long and Short PositionsLong and Short PositionsIn investing, long and short positions represent directional bets by investors that a security will either go up (when long) or down (when short). In the trading of assets, an investor can take two types of positions: long and short. An investor can either buy an asset (going long), or sell it (going short).
- Shadow (Candlestick Wick)Shadow (Candlestick Wick)In the world of finance and charting, a shadow is a line that makes up a candlestick pattern’s wick – the portion of the candlestick that represents price
-
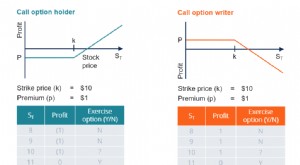
Call Options: A Comprehensive Guide for Investors
A call option, commonly referred to as a “call,” is a form of a derivatives contract that gives the call option buyer the right, but not the obligation, to buy a stockStockWhat is a stock?
-

Understanding Call Prices: Callable Bonds & Preferred Stocks
A call price refers to the price that a preferred stock or bond issuer would pay to buyers if they chose to redeem the callable security before the maturity date. The price is set during the issuance
invest
- Understanding Candlestick Patterns: A Comprehensive Guide
- Understanding Divergence in Technical Analysis: A Guide
- Dragonfly Doji: Understanding This Bullish Reversal Candlestick Pattern
- Hammer Candlestick Pattern: Meaning & Trading Signals
- Hanging Man Candlestick Pattern: Meaning & Trading Signals
- Understanding Japanese Candlestick Charts: A Comprehensive Guide
- Shooting Star Pattern: Technical Analysis & Bearish Reversal
- Spinning Top Candlestick Pattern: Meaning & Trading Signals
- Understanding Candlestick Charts: A Cryptocurrency Trading Guide
-
 Candlestick Charts: Definition & How to Read Them
What Is A Candlestick? A candlestick is a type of price chart used in technical analysis that displays the high, low, open, and closing prices of a security for a specific period. It originated...
-
 Understanding Ascending Channels: A Technical Analysis Guide
An ascending channel occurs when visually analyzing an overall uptrend in the asset price of a stockStockWhat is a stock? An individual who owns stock in a company is called a shareholder and is eligi...