Hanging Man Candlestick Pattern: Meaning & Trading Signals
The “hanging man” is a bearish Bullish and BearishProfessionals in corporate finance regularly refer to markets as being bullish and bearish based on positive or negative price movements. A bear market is typically considered to exist when there has been a price decline of 20% or more from the peak, and a bull market is considered to be a 20% recovery from a market bottom.financial candlestick pattern that represents a potential reversal in an uptrend. In particular, a hanging man pattern forms at the end of an uptrend. Due to the uptrend reaching its peak, a reversal is likely to occur. The hanging man candlestick pattern is shown below:
The hanging man also indicates that there was a notable sell-off during the day, which was unable to be pushed back up again by the buyers.
Summary
- The “hanging man” is a candlestick pattern that represents a potential reversal in an uptrend.
- The hanging man candlestick pattern only occurs if it includes a small real body, long lower shadow, and the asset’s been in an uptrend.
- A candlestick is a type of price chart used to display information about a security’s price movement.
How Does the Hanging Man Occur?
The hanging man candlestick pattern only occurs when two criteria are met:
- The hanging man candlestick comprises a small real body and a long lower shadow.
- The financial asset has been in an uptrend.
When a hanging man candlestick forms in an uptrend, it shows a loss of buyer strength. The hanging man candlestick represents high demand and significant selling. Due to the high demand, buyers can push the stock price near the opening, but a peak is near. The forecasted peak and eventual downtrend provide investors an opportunity to sell existing short positionsLong and Short PositionsIn investing, long and short positions represent directional bets by investors that a security will either go up (when long) or down (when short). In the trading of assets, an investor can take two types of positions: long and short. An investor can either buy an asset (going long), or sell it (going short)..
- Real Body: The wide, box-like section of a candlestick. It examines if a stock’s closing price was greater or less than its opening price.
- Shadow: Sometimes referred to as the wick, a shadow is a line on a candlestick that is used to indicate where the stock price varied relative to the opening and closing prices.
What is a Reversal and an Uptrend?
A reversal is a price direction change of an asset. For example, if an asset was experiencing an uptrend, it would not be beneficial for a reversal to occur. It is because it would change the price direction of an asset downward. For a hanging man candlestick pattern, the reversal is generally short term.
An uptrend represents the upward price movement of an asset.
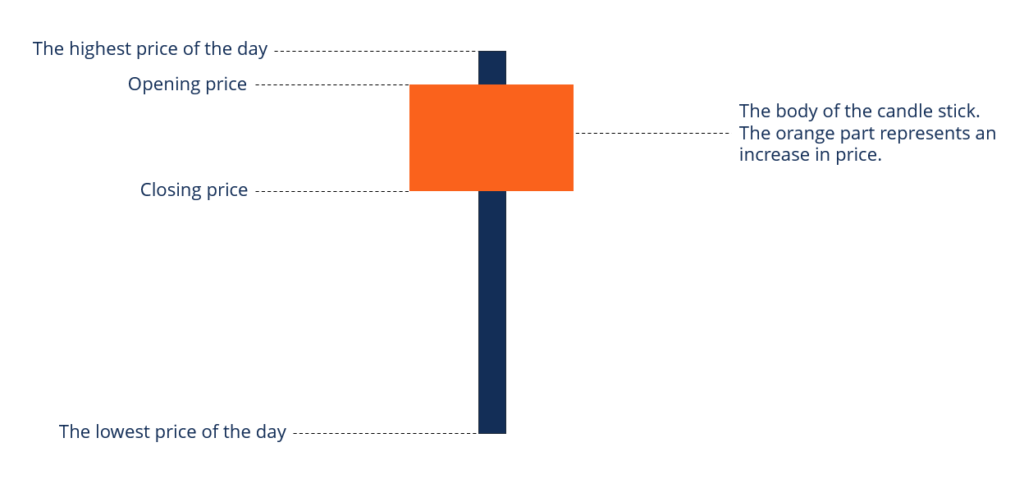
What is a Candlestick?
A candlestick refers to a type of price chart that is used in technical analysisTechnical Analysis - A Beginner's GuideTechnical analysis is a form of investment valuation that analyses past prices to predict future price action. Technical analysts believe that the collective actions of all the participants in the market accurately reflect all relevant information, and therefore, continually assign a fair market value to securities. to display information about a security’s price movement. A candlestick displays high and low prices of securities, along with their opening and closing prices over a specific period of time.
What are the Features of a Candlestick?
Below are the three basic features of a candlestick that measure security price:
- Body: Represents the open-to-close price range.
- Wick: Used to indicate intra-day highs and lows.
- Color: Reveals the direction of market movement. Green or white candlesticks represent a price increase, while red or black represents a price decrease.
Bearish, Bullish, and Continuation Candlestick Patterns
Candlestick patterns are technical trading tools used in finance to predict price direction. Candlestick patterns are divided into three groups – bearish patterns, bullish patterns, and continuation patterns.
Each of the groups below contains separate indicators on the trajectory of price direction.
- Bearish: Most commonly, bearish candlestick patterns form an upward trend and signal a point of reference. Examples of bearish candlestick patterns include the hanging man, shooting star, evening star, three black crows, and the dark cloud coverDark Cloud CoverThe dark cloud cover refers to a candlestick pattern in technical analysis that is a bearish reversal signal. It is observed when a "down".
- Bullish: In most cases, bullish candlestick patterns form after a downtrend in the market. They are also known to signal a reversal of price movement. Examples of bullish candlestick patterns include the hammer, inverse hammer, piercing line, morning star, and three white soldiers.
- Continuation: Continuation candle patterns represent no change in market direction. They can help the trader identify rest periods in the market or when the market trends in a similar direction. Examples of continuation candle patterns include the spinning top, falling three-method, rising three-method, and Doji.
More Resources
CFI offers the Commercial Banking & Credit Analyst (CBCA)™Program Page - CBCAGet CFI's CBCA™ certification and become a Commercial Banking & Credit Analyst. Enroll and advance your career with our certification programs and courses. certification program for those looking to take their careers to the next level. To keep learning and developing your knowledge base, please explore the additional relevant resources below:
- Directional Movement Index (DMI)Directional Movement Index (DMI)The Directional Movement Index (DMI) is an indicator that helps in determining the direction the asset price is moving and the strength of
- Dragonfly Doji CandlestickDragonfly Doji CandlestickA dragonfly doji candlestick is a candlestick pattern with the open, close, and high prices of an asset at the same level. A dragonfly doji
- Shooting StarShooting StarA shooting star is a specific technical analysis formation or pattern that occurs in candlestick charting. It is interpreted as a bearish reversal signal.
- Advanced Technical AnalysisAdvanced Technical AnalysisAdvanced technical analysis usually involves using either multiple technical indicators or a rather sophisticated (i.e., complex) indicator. "Sophisticated"
-

Understanding Adjusted Closing Price: A Comprehensive Guide
The adjusted closing price is a calculation adjustment made to a stock’s closing price. The original closing price is the final price in which a stock, or any other particular kind of security,
-
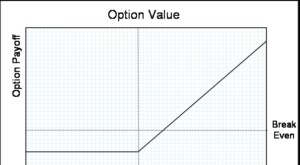
Understanding At-The-Money (ATM) Options: A Comprehensive Guide
At the money (ATM) describes a situation when the strike price of an option is equal to the underlying asset’s current market price. It is a concept of moneyness, which describes the position be
invest
- Black-Scholes Model: Understanding Stock Option Pricing
- Bullish Engulfing Pattern: Meaning, How to Identify & Trade
- Understanding Candlestick Patterns: A Comprehensive Guide
- Double Top Pattern: Definition, Trading Signals & Analysis
- Dragonfly Doji: Understanding This Bullish Reversal Candlestick Pattern
- Understanding the Forward Curve: A Comprehensive Guide
- Hammer Candlestick Pattern: Meaning & Trading Signals
- Understanding Japanese Candlestick Charts: A Comprehensive Guide
- Understanding Candlestick Charts: A Cryptocurrency Trading Guide
-
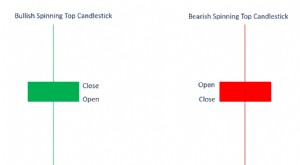 Spinning Top Candlestick Pattern: Meaning & Trading Signals
Spinning top candlestick is a pattern with a short body between an upper and a lower long wick. The spinning top illustrates a scenario where neither the seller nor the buyer has gained. It results in...
-
 Understanding Strike Price: Options Trading Explained
The strike price is the price at which the holder of the option can exercise the option to buy or sell an underlying security, depending on whether they hold a call optionCall OptionA call option, com...