Spinning Top Candlestick Pattern: Meaning & Trading Signals
Spinning top candlestick is a pattern with a short body between an upper and a lower long wick. The spinning top illustrates a scenario where neither the seller nor the buyer has gained. It results in equal opening and closing price units.
The formation of a spinning top candlestick helps determine the probability of a price reversal especially if it happens after a price decline. Because of the small variation in the market trend, the candlestick is referred to as a continuation pattern.
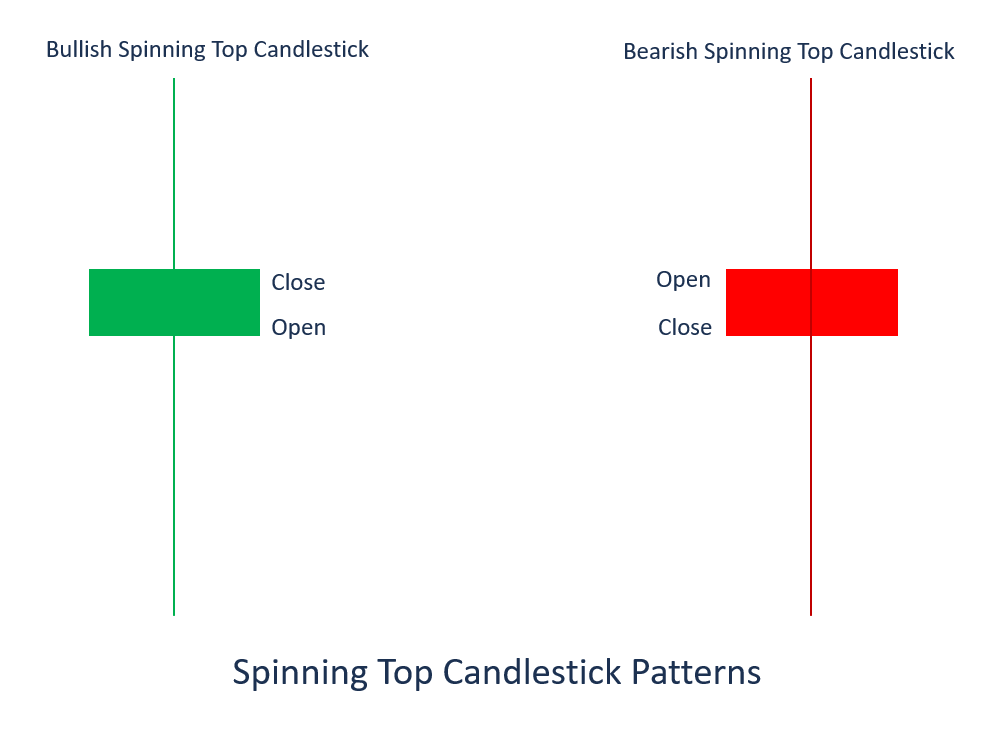
The formation of the candlestick indicates a level of indecision among buyers and sellers, which depicts price reversals, hence creating a neutral pattern. At candle close, the spinning top can be bearish or bullishBullish and BearishProfessionals in corporate finance regularly refer to markets as being bullish and bearish based on positive or negative price movements. A bear market is typically considered to exist when there has been a price decline of 20% or more from the peak, and a bull market is considered to be a 20% recovery from a market bottom.. However, the pattern of the candlestick is mostly found within an uptrend, a downtrend, and a sideways movement, indicating a potential reversal. The bullish trend increases the price further, while the bearish trend lowers the price until the overall price closes where it opened.
Summary
- The candlestick pattern indicates the uncertainty of the future trend of an asset where the traders are unable to sustain the price of a commodity.
- The pattern displays indecision, with many possible sideways movements to be witnessed.
- A spinning top can signify a future price reversal if confirmed by the next candle.
Understanding Spinning Top Candlesticks
A spinning top occurring at the peak of an uptrend can signify that the bullish is losing track and the trend is about to reverse. However, when a spinning top is at the base of a downtrend, it is a sign that the bearish is losing control, and the bullish may take control. It means that a spinning top may alert about an upcoming crucial change in a trend. However, a confirmation from the next candle is key to determine whether the prices will drop after the uptrend.
Active traders should not trade instantly after the formation of a spinning top but rather wait for the confirmation from technical indicatorsTechnical IndicatorA technical indicator is a mathematical pattern derived from historical data used by technical traders or investors to predict future price after the formation of the next candle. It will help eliminate uncertainties in the market since the signal trend reversal will have been established.
For example, during an uptrend, if a bullish occurs after the spinning top at the bottom, the trader could use it as an entry point. Similarly, in an uptrend, if a bearish form at the top in the spinning top pattern, it can be used as an exit point.
How the Spinning Candlestick is Formed
Price movements within the spinning top candlestick indicate that buyers and sellers are overriding each other, resulting in homogenous open and close price trends. Using the spinning top pattern in a trading strategy will help the trader work within the minimum suggested investment time.
The idea behind indecision manifested in the market throughout the formation of the spinning top is that buyers and sellers move prices higher and lower during the trading process. It causes the closing price to reverse back closer to the opening price, and the bull trader forces it back to the top before the market closes.
A spinning top indicates exhaustion after a cycle of uptrends or downtrends price pattern. The gap between the opening price and closing price means that no progress was achieved during the timeframe of the candle. The long upper and lower wick displays a higher level of volatility that occurred during the trading period, with neither bulls nor bears dominating.
Trading with the Spinning Top of a Candlestick Pattern
Most traders use indicators to confirm the signal of a spinning top and gather more facts on the price trends. Trading with the spinning top pattern can be done using derivatives like trading contracts for difference (CFDs)Contract for Difference (CFD)Contract for Difference (CFD) refers to a contract that enables two parties to enter into an agreement to trade on financial instruments based on the price difference between the entry prices and closing prices.. It means that the trader does not need to own the underlying assets but can speculate on their price pattern.
For example, if a trader believes that the spinning top at the support of a downtrend may indicate an approaching reversal, testing the signal will help to predict the price patterns since it indicates the momentum of a specific market at a particular time.
However, a trader needs to apply technical indicators and signals to analyze the trading movements. Such an analysis will protect the trader from straying away from the trading pattern and stick within the risk managementRisk ManagementRisk management encompasses the identification, analysis, and response to risk factors that form part of the life of a business. It is usually done with plan.
How Traders Use a Spinning Top Candlestick Pattern
After creating a trading account, the trader should be able to identify a spinning top candlestick with a short body and long wicks on either side and locate the market trend using technical indicators or trend patterns.
However, each trading method comes with varied risk descriptions. Therefore, the trader must indicate the name of the asset they are willing to trade in the search bar. After confirming the upcoming reversal, the trader may proceed and select either the buy or sell option in the trading ticket.
More Resources
CFI is the official provider of the Capital Markets & Securities Analyst (CMSA)®Program Page - CMSAEnroll in CFI's CMSA® program and become a certified Capital Markets &Securities Analyst. Advance your career with our certification programs and courses. certification program, designed to transform anyone into a world-class financial analyst.
In order to help you become a world-class financial analyst and advance your career to your fullest potential, these additional resources will be very helpful:
- Advanced Technical AnalysisAdvanced Technical AnalysisAdvanced technical analysis usually involves using either multiple technical indicators or a rather sophisticated (i.e., complex) indicator. "Sophisticated"
- Hammer CandlestickHammer CandlestickA hammer candlestick is a candlestick formation that is used by technical analysts as an indicator of a potential impending bullish (upside)
- Dark Cloud CoverDark Cloud CoverThe dark cloud cover refers to a candlestick pattern in technical analysis that is a bearish reversal signal. It is observed when a "down"
- Hanging Man CandlestickHanging Man CandlestickThe “hanging man” is a bearish financial candlestick pattern that represents a potential reversal in an uptrend. In particular, a hanging man
-
Understanding Call Prices: Callable Bonds & Preferred Stocks
A call price refers to the price that a preferred stock or bond issuer would pay to buyers if they chose to redeem the callable security before the maturity date. The price is set during the issuance
-

Call Warrants: Understanding Rights & Investment Potential
A call warrant gives the holder of the investment the right, not the obligation, to purchase the underlying financial securities at a specific price on or before a certain date.If the holder does not
invest
- Bullish Engulfing Pattern: Meaning, How to Identify & Trade
- Understanding Candlestick Patterns: A Comprehensive Guide
- Double Top Pattern: Definition, Trading Signals & Analysis
- Dragonfly Doji: Understanding This Bullish Reversal Candlestick Pattern
- Hammer Candlestick Pattern: Meaning & Trading Signals
- Hanging Man Candlestick Pattern: Meaning & Trading Signals
- Understanding Japanese Candlestick Charts: A Comprehensive Guide
- Shooting Star Pattern: Technical Analysis & Bearish Reversal
- Understanding Candlestick Charts: A Cryptocurrency Trading Guide
-
 Understanding Ascending Channels: A Technical Analysis Guide
An ascending channel occurs when visually analyzing an overall uptrend in the asset price of a stockStockWhat is a stock? An individual who owns stock in a company is called a shareholder and is eligi...
-
 Call Options: A Comprehensive Guide for Investors
A call option, commonly referred to as a “call,” is a form of a derivatives contract that gives the call option buyer the right, but not the obligation, to buy a stockStockWhat is a stock?...