Shooting Star Pattern: Technical Analysis & Bearish Reversal
A shooting star is a specific technical analysis formation or pattern that occurs in candlestick charting. It is interpreted as signaling an impending bearish reversal to the downside.
To be properly interpreted, a shooting star formation is only considered valid when it occurs following a recognizable uptrend of some duration and when it occurs at or near the highest price in recent market action.
The shooting star pattern is just one of many signals of potential market reversals recognized in candlestick charting. Other reversal patterns include engulfing candles, the hanging man pattern, and doji candlestickDragonfly Doji CandlestickA dragonfly doji candlestick is a candlestick pattern with the open, close, and high prices of an asset at the same level. A dragonfly doji formations.
Summary
- A shooting star is a pattern that forms in candlestick trading.
- It is used in technical analysis as an indication of a possible impending reversal in price action to the downside.
- The shooting star pattern is interpreted as a bearish reversal signal because it shows a failed attempt to drive the price higher and a strong selling action, ultimately determining the candlestick’s formation.
Identifying the Shooting Star Pattern
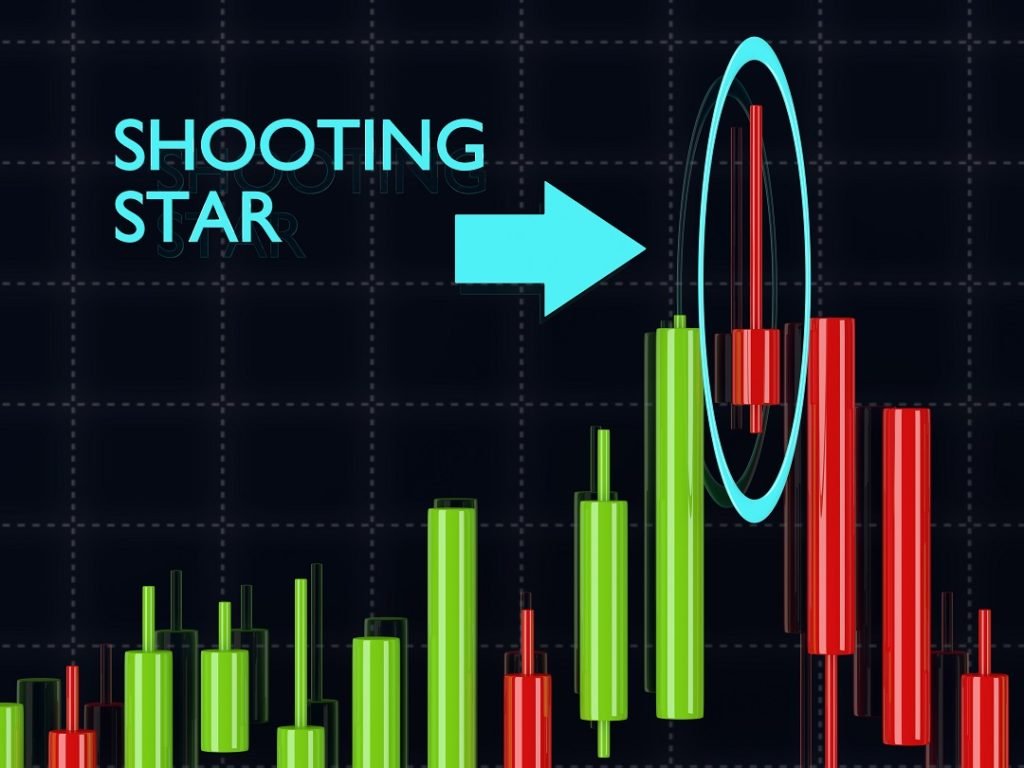
As with all candlestick patterns, a shooting star must be correctly identified to be of use to tradersSix Essential Skills of Master TradersJust about anyone can become a trader, but to be one of the master traders takes more than investment capital and a three-piece suit. Keep in mind: there is a sea of individuals looking to join the ranks of master traders and bring home the kind of money that goes with that title.. The key characteristics of a shooting star candlestick are as follows:
- The upper tail, also known as a “shadow,” which is the line that forms above the body of the candlestick, is at least two to three times longer than the candlestick body.
- The lower tail or shadow – the line that extends below the body of the candlestick – must be either non-existent or very short; it should, at most, not be much longer than the body of the candlestick.
- The candlestick body, which indicates the opening and closing prices, should likewise be very short; in other words, the opening and closing prices should be very near each other.
Additionally, there are some characteristics of a shooting star formation that, if they occur, make the signal of a possible market reversal to the downside stronger. The first of the traits is the closing price. A price close that is below the opening price, indicating that price moved net to the downside for the time frame covered by the candlestick, makes for a stronger shooting star pattern. The pattern is also considered stronger if there is no lower tail or shadow whatsoever.
If the candlestick’s closing price is below the opening price, and there is no lower tail extending below the candlestick body, that shows that price closed at the very lowest price traded during the duration of the candlestick, and this is considered an additionally bearish signalBullish and BearishProfessionals in corporate finance regularly refer to markets as being bullish and bearish based on positive or negative price movements. A bear market is typically considered to exist when there has been a price decline of 20% or more from the peak, and a bull market is considered to be a 20% recovery from a market bottom..
Another strong indication of an impending bearish reversal is when the candlestick’s upper shadow is much longer than the candlestick body – three or four times longer, or more. It indicates that although the price traded significantly higher during the time frame the candlestick reflects, higher prices were strongly rejected as sellers entered the market and buyers exited, eventually driving price sharply lower to end the time period and form the shooting star pattern.
To learn more about candlestick patterns, check out CFI’s Trading Using Technical Analysis course!
Example
A 15-minute chart of GBP/USD in the forex market is shown below, illustrating an instance of the shooting star formation occurring and correctly presaging a turn to the downside.
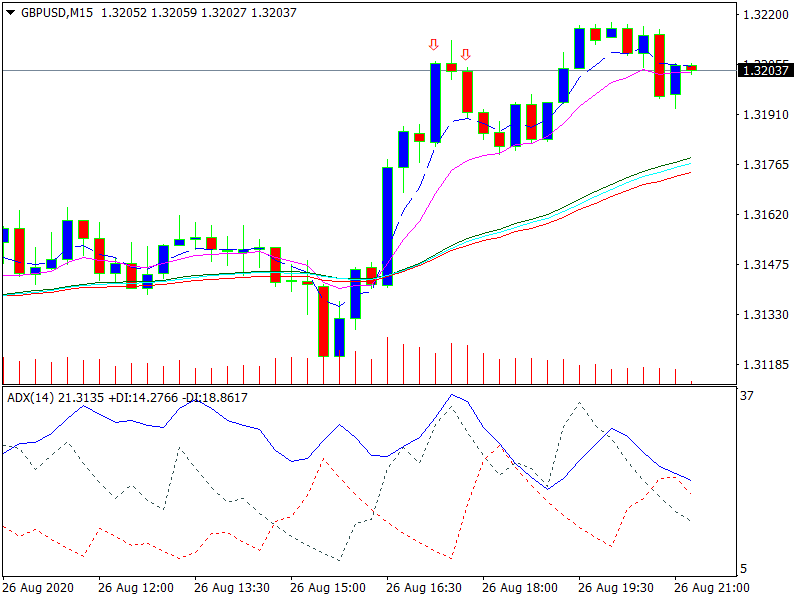
In approximately the center of the chart, you can see a strong, sustained up move in GBP/USD. Several candlesticks show the currency pair moving sharply higher, but then a candlestick (the one that occurs between the two red arrows pointing down) forms a shooting star pattern. There is a long upper tail or upper shadow, a comparatively much shorter lower tail or shadow, and a noticeably short body with the price closing below the candle’s opening price.
In such an instance, the shooting star formation was correct in its prediction. The price takes a sharp dip to the downside over the time frame of the next three candlesticks that form before resuming the overall trend to the upside. A trader who sold short upon seeing the shooting star pattern could’ve quickly pocketed a profit on a short-term, intraday trade.
In this case, the shooting star signaled what turned out to be only a short-term reversal. However, the pattern sometimes indicates a long-term reversal from an overall uptrend to an overall downtrend.
Continue Learning
CFI is the official provider of the global Capital Markets & Securities Analyst (CMSA)®Program Page - CMSAEnroll in CFI's CMSA® program and become a certified Capital Markets &Securities Analyst. Advance your career with our certification programs and courses. certification program, designed to help anyone become a world-class financial analyst. To keep advancing your career, the additional CFI resources below will be useful:
- Advanced Technical AnalysisAdvanced Technical AnalysisAdvanced technical analysis usually involves using either multiple technical indicators or a rather sophisticated (i.e., complex) indicator. "Sophisticated"
- Bullish Engulfing CandlestickBullish Engulfing CandlestickA bullish engulfing candlestick shows a pattern of trading prices for a particular security, indicating a reversal in price trends. A
- Dark Cloud CoverDark Cloud CoverThe dark cloud cover refers to a candlestick pattern in technical analysis that is a bearish reversal signal. It is observed when a "down"
- USD/CAD Currency CrossUSD/CAD Currency CrossThe USD/CAD currency pair represents the quoted rate for exchanging US to CAD, or, how many Canadian dollars one receives per US dollar. For example, a USD/CAD rate of 1.25 means 1 US dollar is equivalent to 1.25 Canadian dollars. The USD/CAD exchange rate is affected by economic and political forces on both
-

Understanding Call Prices: Callable Bonds & Preferred Stocks
A call price refers to the price that a preferred stock or bond issuer would pay to buyers if they chose to redeem the callable security before the maturity date. The price is set during the issuance
-

Call Warrants: Understanding Rights & Investment Potential
A call warrant gives the holder of the investment the right, not the obligation, to purchase the underlying financial securities at a specific price on or before a certain date.If the holder does not
invest
- Bullish Engulfing Pattern: Meaning, How to Identify & Trade
- Understanding Candlestick Patterns: A Comprehensive Guide
- Dragonfly Doji: Understanding This Bullish Reversal Candlestick Pattern
- Evening Star Pattern: Meaning, Interpretation & Trading Signals
- Hammer Candlestick Pattern: Meaning & Trading Signals
- Hanging Man Candlestick Pattern: Meaning & Trading Signals
- Understanding Japanese Candlestick Charts: A Comprehensive Guide
- Spinning Top Candlestick Pattern: Meaning & Trading Signals
- Understanding Candlestick Charts: A Cryptocurrency Trading Guide
-
 Understanding Ascending Channels: A Technical Analysis Guide
An ascending channel occurs when visually analyzing an overall uptrend in the asset price of a stockStockWhat is a stock? An individual who owns stock in a company is called a shareholder and is eligi...
-
 Call Options: A Comprehensive Guide for Investors
A call option, commonly referred to as a “call,” is a form of a derivatives contract that gives the call option buyer the right, but not the obligation, to buy a stockStockWhat is a stock?...