January Barometer: Predicting Market Performance - Explained
The January Barometer is the idea that the investment performance of the S&P 500S&P 500 IndexThe Standard and Poor’s 500 Index, abbreviated as S&P 500 index, is an index comprising the stocks of 500 publicly traded companies in the in the month of January is representative of the predicted performance of the entire year. For example, if the month of January yields positive momentum, it is said that the remainder of the year will rise as well. The opposite versa is also true. If the market performs poorly in January, it is said that the remainder of the year will do the same.
The concept of the January Barometer stemmed from a 1967 novel called “Stock Trader’s Almanac” by Yale Hirsch. It continues to be present in many people’s trading strategies.
Summary
- The January Barometer is a market theory that is considered a forward-looking indicator of an index’s annualized returns based on the momentum illustrated in the respective month of January.
- The January Barometer was first mentioned in “Stock Trader’s Almanac” by Yale Hirsch, which was published in 1967.
- The concept is best associated with the S&P 500 Index and may not necessarily be as good of an indicator on any other indices, especially equities that are not from the U.S.
Understanding the January Barometer
Traders who believe in the theory may utilize the results to forecast and time the market. Particularly, as an indicator, they may only invest in the market during times that January is up and avoid it when the month’s returns are down. It is most often connected to U.S. equities, particularly focusing on the S&P 500.
Such a belief stems from the correlation found in data the S&P 500 predicted and actual returns between 1966 to 2001. In fact, dating back to 1928, the S&P 500 was tested 91 times to determine whether there was a correlation between their annualized and respective January months.
It appeared that on those 91 occasions, the market indeed ended the year in a similar direction as the month of January 63 times. However, it is important to be aware that the phenomenon may be coincidental, as positive returns also occurred 75% of the time within the U.S. equity markets. Thus, the strategy may not necessarily improve one’s market timingMarket TimingMarket timing refers to an investing strategy through which a market participant makes buying or selling decisions by predicting the price movements of the.
Recent Example
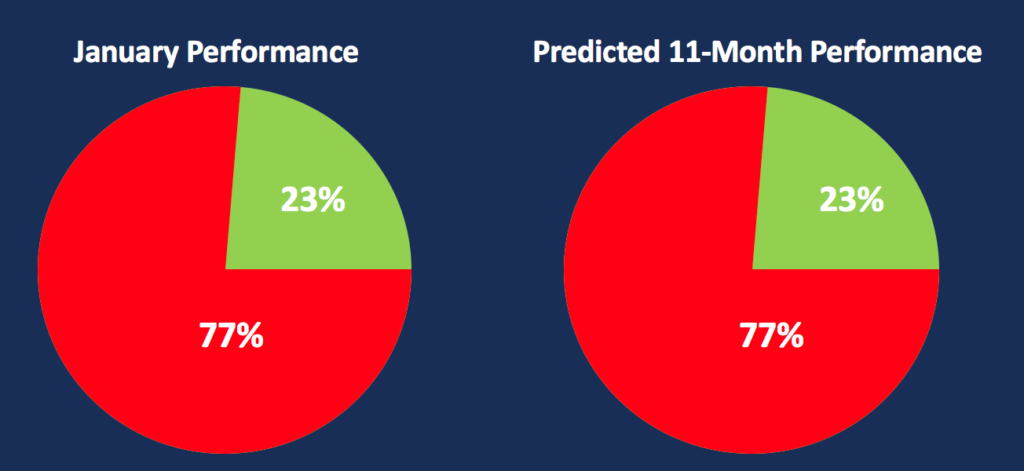
In 2017, the S&P 500 gained 2% in the month of January. Following afterward, the remaining months generated an annualized return of 19%, resulting in an upwards trend.
Problems with the January Barometer
There are two major problems with using the January Barometer:
- The track record of success forecasts just below 70% of the time.
- There is the assumption that investors continue to hold despite the index’s drawdown.
Although the success rate is fairly high, it is important for investors to understand that using the January Barometer as an indicator should be taken with a grain of salt, as opposed to a trading principle. It is best used to gain insight into the overall market’s health. By doing so, one can maintain a bullishBullish and BearishProfessionals in corporate finance regularly refer to markets as being bullish and bearish based on positive or negative price movements. A bear market is typically considered to exist when there has been a price decline of 20% or more from the peak, and a bull market is considered to be a 20% recovery from a market bottom. perspective and gain confidence throughout the trading year when January yields positive momentum.
Debunking Myths of the January Barometer
Mark Hulbert, the editor of the Hulbert Financial Digest, believes the January Barometer is ineffective. He states that the stock market rises two-thirds of the time, regardless of January’s performance, which ultimately makes the theory null.
Hulbert also disagrees with the point that if the market falls in January, the remaining 11 months should also fall. Hulbert looked at the returns of the Dow Jones Industrial Average (DJIA)Dow Jones Industrial Average (DJIA)The Dow Jones Industrial Average (DJIA), also referred to as "Dow Jones” or "the Dow", is one of the most widely-recognized stock market indices. from 1897 through 2008. He found that when the Dow fell in January, its average monthly return for the remaining months was 0.25%.
Rather, it’s been mentioned that market performance in December is a better predictor of the subsequent 11 months as opposed to January, while November is the third most accurate predictor. The three months with no predictive ability at all are February, August, and September.
However, it is best to remember that the January Barometer is most effective with the S&P 500, not the DJIA.
Learn More
CFI is the official provider of the Capital Markets & Securities Analyst (CMSA)®Program Page - CMSAEnroll in CFI's CMSA® program and become a certified Capital Markets &Securities Analyst. Advance your career with our certification programs and courses. certification program, designed to transform anyone into a world-class financial analyst.
To keep learning and developing your knowledge of financial analysis, we highly recommend the additional resources below:
- Annualized Total ReturnAnnualized Total ReturnAn annualized total return is the return earned on an investment each year. It is computed as a geometric average of the returns of each year earned over a
- Dogs of the DowDogs of the DowThe Dogs of the Dow refers to a stock-picking strategy that uses the ten highest dividend-yielding stocks from the Dow Jones Industrial Average (DJIA) each
- How to Invest in the S&P 500 IndexHow to Invest in the S&P 500 IndexWe will discuss how portfolio managers and asset management companies invest in the S&P 500 Index. The S&P 500 Index itself is only a measure
- Momentum InvestingMomentum InvestingMomentum investing is an investment strategy aimed at purchasing securities that have been showing an upward price trend or short-selling securities that
-

Margin of Safety: A Powerful Investment Principle
The margin of safety is an investment principle where the investor buys stocks when the market price is below their actual value. It is evaluated as the change between the price of a financial in
-

Understanding the Money Market: Short-Term Debt & Lending
The money market is an organized exchange market where participants can lend and borrow short-term, high-quality debt securities with average maturities of one year or less. It enables governments, ba
invest
- Understanding the Investment Accumulation Phase: Building Wealth Over Time
- Bandwagon Effect: Understanding Social Influence & Conformity
- Understanding the Call Market: Trading Hours & Price Determination
- Understanding the Credit Curve: A Guide for Investors
- Understanding the Dot-Com Bubble: Causes, Impact & Lessons Learned
- Dow 30 Explained: Understanding the Dow Jones Industrial Average
- Understanding the January Effect: Stock Market Trends & Causes
- Rule of 72: Calculate Investment Doubling Time | [Your Brand Name]
- Nifty 50: History, Significance & Key Stocks - A Comprehensive Guide
-
 Keltner Channel: Definition, How to Use & Trading Strategies
Keltner Channel refers to a technical analysis indicator composed of three separate lines. It includes a central moving average line along with channel lines located above and below the central one.&n...
-
 Klinger Oscillator: Understanding Long-Term Trends & Price Reversals
The Klinger oscillator is a financial tool that was designed by Stephen Klinger in 1977 to predict long-term trends in money flow while also detecting short-term fluctuations. In addition, it predicts...