Bandwagon Effect: Understanding Social Influence & Conformity
The bandwagon effect is the tendency of people to take certain actions or arrive at a conclusion primarily because other people are doing so. The phenomenon is observed in various fields, such as economicsEconomicsCFI's Economics Articles are designed as self-study guides to learn economics at your own pace. Browse hundreds of articles on economics and the most important concepts such as the business cycle, GDP formula, consumer surplus, economies of scale, economic value added, supply and demand, equilibrium, and more, politics, and psychology. Financial markets are no different.

The bandwagon effect works through a self-reinforcing mechanism. It expands using positive feedback loops, which means that the effect becomes stronger as more people join.
The Bandwagon Effect in Economics
It is important to understand how the bandwagon effect is described in economics because it illustrates the magnitude of the effect.
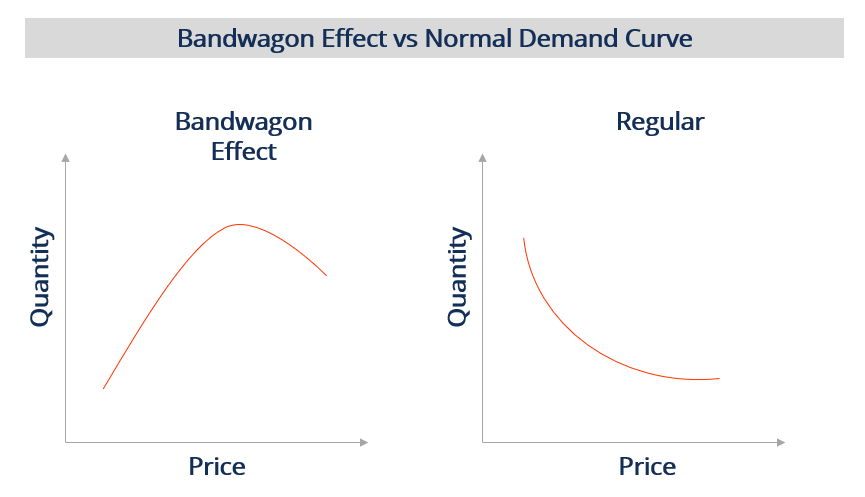
Gary Becker, a well-known economist from the University of Chicago, purported that the bandwagon effect is powerful enough to flip the demand curveDemand CurveThe demand curve is a line graph utilized in economics, that shows how many units of a good or service will be purchased at various prices to be upward sloping.
A typical demand curve is downward sloping, which means as prices rise, the demand falls. However, as Becker posits, an upward sloping would imply that even as prices rise, the demand rises. The figure below illustrates the two demand curves.
The Bandwagon Effect in Financial Markets
The bandwagon effect works in two ways in the financial markets:
1. Price bubbles
Price bubbles often happen in financial markets wherein the price for a particularly popular security keeps on rising. The price can rise beyond a point that would be warranted by the fundamentals, causing the security to be highly overvalued. It happens because many investors line up to buy the security bidding up the price, which in return attracts more investors.
2. Liquidity holes
In case of unexpected news or events, market participants tend to halt trading activity until the situation becomes clear. It reduces the number of buyers and sellers in the market, causing liquidity to decrease significantly.
The lack of liquidity distorts price discovery and causes massive shifts in asset prices. Such price shifts can lead to increased panic, which further increases uncertainty, and the cycle continues.
In the next section, we will look at two examples of the bandwagon effect in the real world.
Practical Examples
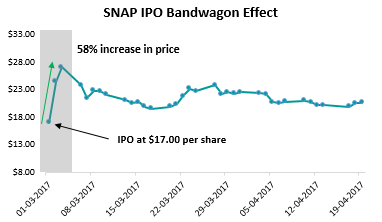
SNAP Inc.’s Initial Public Offering
SNAP Inc., a technology company, held its Initial Public Offering (IPO) in early 2017. The IPO came in the aftermath of the great technology rally, which saw a massive appreciation in the stock prices of technology companies, such as Amazon, NVIDIA, Netflix, etc.
The shares of SNAP Inc. were offered at a price of $17 per share. The price appreciated as much as 44% to $24 in a single day. It rose further to $27 two days after the IPO, which was about a 58% appreciation to the initial offer price of $17.
The price surge was followed by a correction to around $20 per share over the next few trading days. The above sequence of events is an example of the bandwagon effect. Investors kept bidding up the price for two days, as they blindly followed other investors into what they all perceived to be another technology company with significant upward potential. Below are illustrations of SNAP IPO’s bandwagon effect and follow-up

Black Monday
October 19, 1987, often called Black MondayBlack Monday"Black Monday" – as it is referenced today – took place on October 19 (a Monday) in 1987. On this day, stock markets around the world crashed, though the, saw the largest market crash in history when the Dow Jones Industrial Index fell 22% in a single day. The crash was attributed to many causes, ranging from economic news to portfolio insurance strategies.
However, a study done by the economist Robert Shiller in the aftermath of the crash points to the bandwagon effect. In the survey conducted by Shiller, most participants pointed to the expectation of an impending crash rather than a concrete reason. The widespread use of portfolio insurance strategies that have been blamed for the magnitude of the crash is further evidence of the bandwagon effect.
Additional Resources
CFI is the official provider of the Commercial Banking & Credit Analyst (CBCA)™Program Page - CBCAGet CFI's CBCA™ certification and become a Commercial Banking & Credit Analyst. Enroll and advance your career with our certification programs and courses. certification program, designed to transform anyone into a world-class financial analyst.
In order to help you become a world-class financial analyst and advance your career to your fullest potential, these additional resources will be very helpful:
- Emotional IntelligenceEmotional IntelligenceEmotional intelligence also known as the emotional quotient (EQ) is the ability to manage one's emotions and the emotions of others. For
- Momentum InvestingMomentum InvestingMomentum investing is an investment strategy aimed at purchasing securities that have been showing an upward price trend or short-selling securities that
- Spread TradingSpread TradingSpread trading – also known as relative value trading – is a method of trading that involves an investor simultaneously buying one security and selling a
- Stock Investing: A Guide to Growth InvestingStock Investing: A Guide to Growth InvestingInvestors can take advantage of new growth investing strategies in order to more precisely hone in on stocks or other investments offering above-average growth potential.
-

Kelly Criterion: A Guide to Optimal Betting & Investment Strategy
Kelly criterion is a mathematical formula for bet sizing, which is frequently used by investors to decide how much money they should allocate to each investment or bet through a predetermined fraction
-
Keltner Channel: Definition, How to Use & Trading Strategies
Keltner Channel refers to a technical analysis indicator composed of three separate lines. It includes a central moving average line along with channel lines located above and below the central one.&n
invest
- Understanding the Investment Accumulation Phase: Building Wealth Over Time
- Clientele Effect: How Investor Preferences Impact Stock Prices
- Dow 30 Explained: Understanding the Dow Jones Industrial Average
- Understanding the Hamptons Effect: Trading Trends & Labor Day
- Understanding the January Effect: Stock Market Trends & Causes
- Understanding the Joseph Effect: Trends vs. Randomness
- Rule of 72: Calculate Investment Doubling Time | [Your Brand Name]
- Understanding the Wealth Effect: How Rising Asset Values Impact Spending
- Nifty 50: History, Significance & Key Stocks - A Comprehensive Guide
-
 January Barometer: Predicting Market Performance - Explained
The January Barometer is the idea that the investment performance of the S&P 500S&P 500 IndexThe Standard and Poor’s 500 Index, abbreviated as S&P 500 index, is an index comprising t...
-
 K-Ratio Explained: Measuring Investment Growth & Consistency
The K-Ratio is a statistical tool that helps us measure two things – the growth of return and the consistency of that growth over a specified period. It is often used to determine the risk vs. r...