Understanding the January Effect: Stock Market Trends & Causes
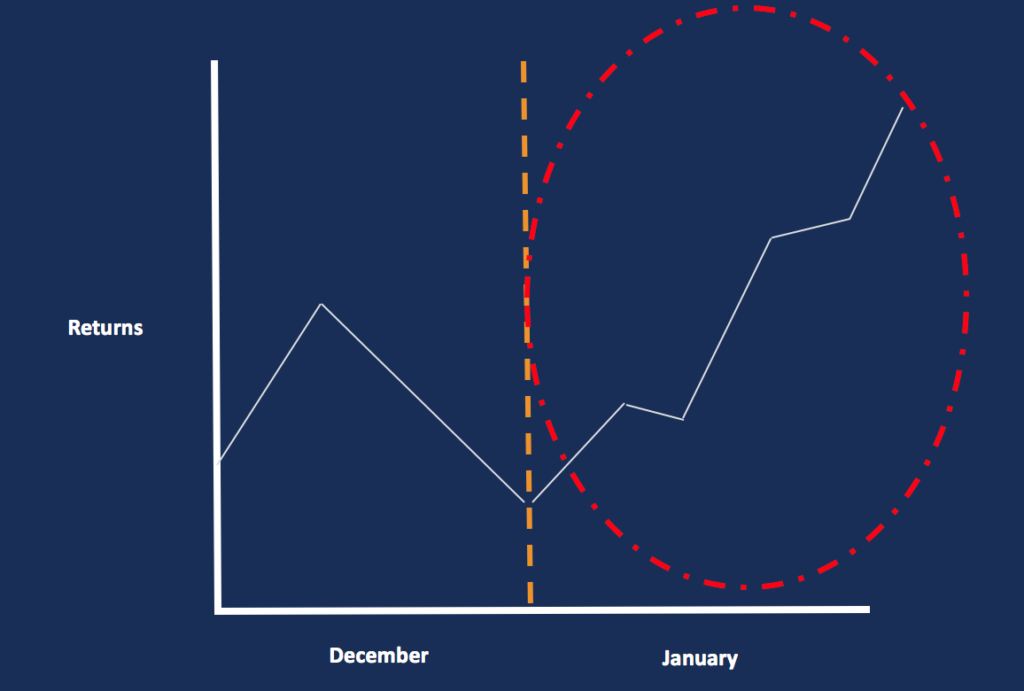
The January Effect is known to be a seasonal increase in stock prices throughout the month of January. The increase in demand for stocks is often preceded by a decrease in price during the month of December, often due to tax-loss harvesting. An alternative reason for the rise in demand is the effect of year-end bonuses individuals receive that are invested in the market.
Summary
- The January Effect is a tendency for increases in stock prices during the beginning of the year, particularly in the month of January.
- The cause behind the January Effect is attributed to tax-loss harvesting, consumer sentiment, year-end bonuses, raising year-end report performances, and more.
- The January Effect appears to affect small-cap stocksSmall Cap StockA small cap stock is a stock of a publicly traded company whose market capitalization ranges from $300 million to approximately $2 billion. more than large-cap stocks, which is apparent when comparing the historical values of the Russell 2000 with the Russell 1000.
Understanding the January Effect
The January Effect appears to affect small-cap companies more than mid- or large-cap companies due to their lower liquidityLiquidityIn financial markets, liquidity refers to how quickly an investment can be sold without negatively impacting its price. The more liquid an investment is, the more quickly it can be sold (and vice versa), and the easier it is to sell it for fair value. All else being equal, more liquid assets trade at a premium and illiquid assets trade at a discount.. Some economists postulate that the January effect substantiates the fact that markets are inefficient, as efficient markets stem from the belief that higher returns are only possible by taking on higher-risk stocks.
Analyzing data from the beginning of the 20th century, it has been found that a variety of asset classes had outperformed the market during the month of January, which led to the belief that the January Effect indeed exists. However, over time, especially in recent years, the markets have begun to adjust to the phenomenon.
Furthermore, at the beginning of 2018, more individuals have begun using tax-sheltered retirement plans and have less purpose to sell at the end of the year to receive a tax loss.
Additional Drivers Behind the January Effect
Beyond the hypothesis of tax-loss harvesting and bonuses, it appears that the January Effect may also be driven by consumer sentiment. As January is the beginning of a new year, many investors believe that the start of the year is the best time to begin investing for their future, under a clean slate.
Another reason may perhaps stem from the fact that mutual fund managersFamous Fund ManagersThe following article lists some of the fund managers that have been regarded as exceptional. This list includes investors that have created funds or managed very profitable funds. Fund managers included are Peter Lynch, Abigail Johnson, John Templeton, and John Bogle. hope to purchase and retain top-performing stocks within their portfolio and eliminate losers in order to heighten their year-end performance reports.
Past Studies and Comments
Based on a study that analyzed data between 1904 and 1974, the average return for stocks during January was approximately five times greater than any other remaining months throughout the year. In fact, Salomon Smith Barney performed an analysis behind stock performance between 1972 to 2002 and learned that small-cap stocks outperformed large-cap stocks during January.
Efficient market theorists believe that modern markets are too efficient for the January Effect to affect trading. That is, investors would anticipate such an effect and purchase stocks in December, as others begin to sell, which would ultimately offset the discrepancy and result in equilibrium.
The January Effect in Recent News
For 2020, January was both a good and bad month for investing. While 10 of the 23 countries within the MSCI World Index of global developed markets generated positive returns, more than half lost their money. For example, Portugal was up 6.1%, while Austria was down 5%.
Essential Knowledge to Prepare for the January Effect
As an investor, it is important to understand the fundamentals of a company to be better equipped when making decisions during the January spike. It involves researching the company’s financial health, such as revenues, growth potential, and profit marginsProfit MarginIn accounting and finance, profit margin is a measure of a company's earnings relative to its revenue. The three main profit margin metrics, along with other aspects such as management, market position, and more.
Understanding the key elements above will help comprehend price swings and movements and ultimately provide greater confidence in the stock picks that yield higher capital appreciation potential.
Additional Resources
CFI is the official provider of the global Capital Markets & Securities Analyst (CMSA)®Program Page - CMSAEnroll in CFI's CMSA® program and become a certified Capital Markets &Securities Analyst. Advance your career with our certification programs and courses. certification program, designed to help anyone become a world-class financial analyst. To keep advancing your career, the additional resources below will be useful:
- January BarometerJanuary BarometerThe January Barometer is the idea that the investment performance of the S&P 500 in the month of January is representative of the predicted
- Halloween StrategyHalloween StrategyThe Halloween strategy refers to a market-timing strategy which shows that equity securities perform better between October 31st and May 1st.
- Market CapitalizationMarket CapitalizationMarket Capitalization (Market Cap) is the most recent market value of a company’s outstanding shares. Market Cap is equal to the current share price multiplied by the number of shares outstanding. The investing community often uses the market capitalization value to rank companies
- Stock Market IndexStock Market IndexA stock market index, also known as a stock index, measures a section of the stock market. In other words, the index measures the change in
-

Kelly Criterion: A Guide to Optimal Betting & Investment Strategy
Kelly criterion is a mathematical formula for bet sizing, which is frequently used by investors to decide how much money they should allocate to each investment or bet through a predetermined fraction
-
Keltner Channel: Definition, How to Use & Trading Strategies
Keltner Channel refers to a technical analysis indicator composed of three separate lines. It includes a central moving average line along with channel lines located above and below the central one.&n
invest
- Bandwagon Effect: Understanding Social Influence & Conformity
- Clientele Effect: How Investor Preferences Impact Stock Prices
- Dow 30 Explained: Understanding the Dow Jones Industrial Average
- Understanding the Hamptons Effect: Trading Trends & Labor Day
- January Barometer: Predicting Market Performance - Explained
- Understanding the Joseph Effect: Trends vs. Randomness
- Rule of 72: Calculate Investment Doubling Time | [Your Brand Name]
- Understanding the Wealth Effect: How Rising Asset Values Impact Spending
- Nifty 50: History, Significance & Key Stocks - A Comprehensive Guide
-
 Understanding Implied Rates: A Comprehensive Guide
The implied rate is an interest rate that expresses the difference between the forward/future rate and the spot rate. It serves as a useful tool for comparing returns across different assets and can b...
-
 K-Ratio Explained: Measuring Investment Growth & Consistency
The K-Ratio is a statistical tool that helps us measure two things – the growth of return and the consistency of that growth over a specified period. It is often used to determine the risk vs. r...