Klinger Oscillator: Understanding Long-Term Trends & Price Reversals
The Klinger oscillator is a financial tool that was designed by Stephen Klinger in 1977 to predict long-term trends in money flow while also detecting short-term fluctuations. In addition, it predicts price reversals in a financial market by extensively comparing volume to price. Volume refers to how many units of a security are trading per unit of time.
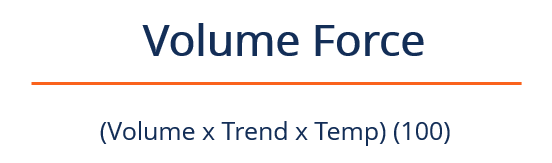
The Klinger oscillator is based on the concept of force volume, which consists of volume itself, price trends, and temp (a number of if/then statements comprising volume/price).
The Klinger oscillator can be combined with other popular indicators, such as the Stochastic oscillatorStochastic OscillatorThe Stochastic Oscillator is an indicator that compares the most recent closing price of a security to the highest and lowest prices during a specified period of time. It gives readings that move back and forth between zero and 100 to provide an indication of the security's momentum., in order to increase overall relevance, accuracy, and dependability.
Investors may also use the Klinger oscillator in conjunction with trendlines, price channels, or triangles to confirm price breakouts or breakdowns.
How It Works
In order to simplify such a technical topic, it is beneficial to illustrate the steps that are taken during the Klinger oscillator operation process.
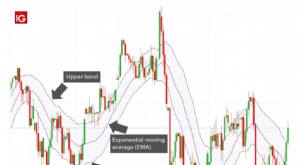
Similar to most oscillators, the Klinger oscillator depends on differences between two specific exponential moving averages (EMA). An exponential moving average (EMA)Exponential Moving Average (EMA)The Exponential Moving Average (EMA) is a technical indicator used in trading practices that shows how the price of an asset or security changes over a is a statistical calculation used to analyze recent data points through the creation of averages within the series of data.
The Klinger oscillator measures the EMA of both price and volume. When a shorter EMA (shorter time periods) assumes a greater value than a longer EMA (longer time periods), it means that the price of a certain security is on an uptrend.
Conversely, when a higher EMA takes on a greater value than a shorter EMA, it suggests that the price of a specific security is experiencing a downtrend.
The default settings of the Klinger oscillator measure a 34-period EMA (a shorter EMA) and a 55-period EMA (a longer EMA).
In addition to EMAs, the Klinger oscillator uses volume force to measure the number of units of a security, open/closing prices, and if/then statements.
To generalize simply, the Klinger oscillator compares the EMAs of price and volume of a specific security in order to determine long-term trends in money flowMoney FlowMoney flow is a technical indicator used to assess the future movement of prices based on demand and supply. It is used to construct the.
Although it is hard to understand, the Klinger oscillator is an exceptional tool that is used extensively in the technical analysis community due to its predictive value.
Trading with the Klinger Oscillator
Regarding technical analysisTechnical Analysis - A Beginner's GuideTechnical analysis is a form of investment valuation that analyses past prices to predict future price action. Technical analysts believe that the collective actions of all the participants in the market accurately reflect all relevant information, and therefore, continually assign a fair market value to securities. and financial modeling, the Klinger oscillator consists of a centerline and two-colored lines being a blue line and a red line.
The red line is called the “Klinger,” while the blue line is referred to as the “signal.” The colored lines, specifically when they cross over one another or the centerline, are critical points to be aware of when conducting technical analysis. They are considered critical points because they determine the buy and sell signals.
Buy Signal
A buy signal is formed when there is a crossover between the red and blue lines that occurs under the centerline. Once a buy signal is evident, it is likely that an investor will be a purchaser because they expect the price of a specific security to experience an uptrend.
Sell Signal
A sell signal is formed when there is a crossover between the red and blue lines that occurs above the centerline. Once a sell signal is evident, it is likely that an investor will become a seller because they expect the price trend of the security to decline.
Limitations of the Klinger Oscillator
To some, it may seem that the use of the Klinger oscillator is a no-brainer due to its measurement and prediction of short and long-term price trends. However, it experiences some limitations that reduce the overall accuracy of the tool, resulting in a plethora of false signals.
Crossovers
Signal line crossovers occur very frequently. The regular occurrence makes it hard for the Klinger oscillator to filter out the worthwhile crossovers.
In addition to frequency, zero-line crossovers may cause issues relating to sustained price direction, making the indicator fail to predict trading opportunities.
Divergence
As for divergence, the limitation of the Klinger oscillator is that divergence may occur too early, resulting in large missing segments of a trend. Sometimes, the oscillator’s divergence fails to predict the price reversal at all. However, it is expected as divergence is known for not being a reliable tool for predicting potential price reversals.
Related Readings
CFI is the official provider of the Capital Markets & Securities Analyst (CMSA)®Program Page - CMSAEnroll in CFI's CMSA® program and become a certified Capital Markets &Securities Analyst. Advance your career with our certification programs and courses. certification program, designed to transform anyone into a world-class financial analyst.
To keep learning and developing your knowledge of financial analysis, we highly recommend the additional resources below:
- Advanced Technical AnalysisAdvanced Technical AnalysisAdvanced technical analysis usually involves using either multiple technical indicators or a rather sophisticated (i.e., complex) indicator. "Sophisticated"
- McClellan OscillatorMcClellan Oscillator - Technical AnalysisThe McClellan Oscillator is a type of momentum oscillator. The McClellan Oscillator is calculated using exponential moving averages, and is designed to indicate the strength or weakness of price movement, rather than its direction.
- Speed LinesSpeed Lines - Technical AnalysisSpeed lines are an analysis tool used to determine support and resistance levels. They are not intended to be used as a standalone technical indicator.
- Volume Price Trend (VPT) IndicatorVolume Price Trend Indicator (VPT)The Volume Price Trend Indicator (VPT) is a stock market indicator that helps traders relate a stock's price and trading volume.
-

Kelly Criterion: A Guide to Optimal Betting & Investment Strategy
Kelly criterion is a mathematical formula for bet sizing, which is frequently used by investors to decide how much money they should allocate to each investment or bet through a predetermined fraction
-
Keltner Channel: Definition, How to Use & Trading Strategies
Keltner Channel refers to a technical analysis indicator composed of three separate lines. It includes a central moving average line along with channel lines located above and below the central one.&n
invest
- Understanding the Investment Accumulation Phase: Building Wealth Over Time
- Bandwagon Effect: Understanding Social Influence & Conformity
- Understanding the Call Market: Trading Hours & Price Determination
- Understanding the Credit Curve: A Guide for Investors
- Dow 30 Explained: Understanding the Dow Jones Industrial Average
- MACD Oscillator: Understanding & Trading Strategies
- Rule of 72: Calculate Investment Doubling Time | [Your Brand Name]
- Stochastic Oscillator: Understanding Momentum & Trading Signals
- Nifty 50: History, Significance & Key Stocks - A Comprehensive Guide
-
 Understanding the Joseph Effect: Trends vs. Randomness
The Joseph Effect, which derives its name from a Biblical reference, is a phrase created by Benoit Mandelbrot, a Polish-born French-American mathematician. The phrase asserts that variations over time...
-
 K-Ratio Explained: Measuring Investment Growth & Consistency
The K-Ratio is a statistical tool that helps us measure two things – the growth of return and the consistency of that growth over a specified period. It is often used to determine the risk vs. r...