Keltner Channel: Definition, How to Use & Trading Strategies
Keltner Channel refers to a technical analysis indicator composed of three separate lines. It includes a central moving average line along with channel lines located above and below the central one.
Summary
- Keltner Channel refers to a technical analysis indicator composed of three separate lines. It includes a central moving average line, along with channel lines located above and below the central one.
- It is named after American grain trader Chester W. Keltner, who described it in his 1960 book entitled “How to Make Money in Commodities.”
- It was later revised, and the modern version uses the exponential moving average (EMA) of the price as the center line.
History of the Keltner Channel
The Keltner Channel is named after American grain trader Chester W. Keltner, who described it in his 1960 book entitled “How to Make Money in Commodities.”
Keltner initially described it as a ten-day moving average, and his initial version showed the center line showing the typical price, with it being the average of the high, low, and close (closing) priceAdjusted Closing PriceThe adjusted closing price is a calculation adjustment made to a stock’s closing price. The original closing price is the final price in which a stock, or. The lines above and below the centerline were drawn at a distance away, with the said distance being the simple moving average of the past 10 days’ trading ranges.
Here, the overall strategy is to regard a closing price above the upper line as a strong bullish signal while a close below the lower line is bearish. The Keltner Channel was later further revised by Linda Bradford Raschke, who added in different averaging periods, an exponential moving average, and the average true range (ATR) for the bands.
These revisions were not made separate from Keltner’s original idea, and there is still some confusion behind the exact definition of the Keltner Channel. However, the revisions are commonly accepted and used.
Understanding the Keltner Channel
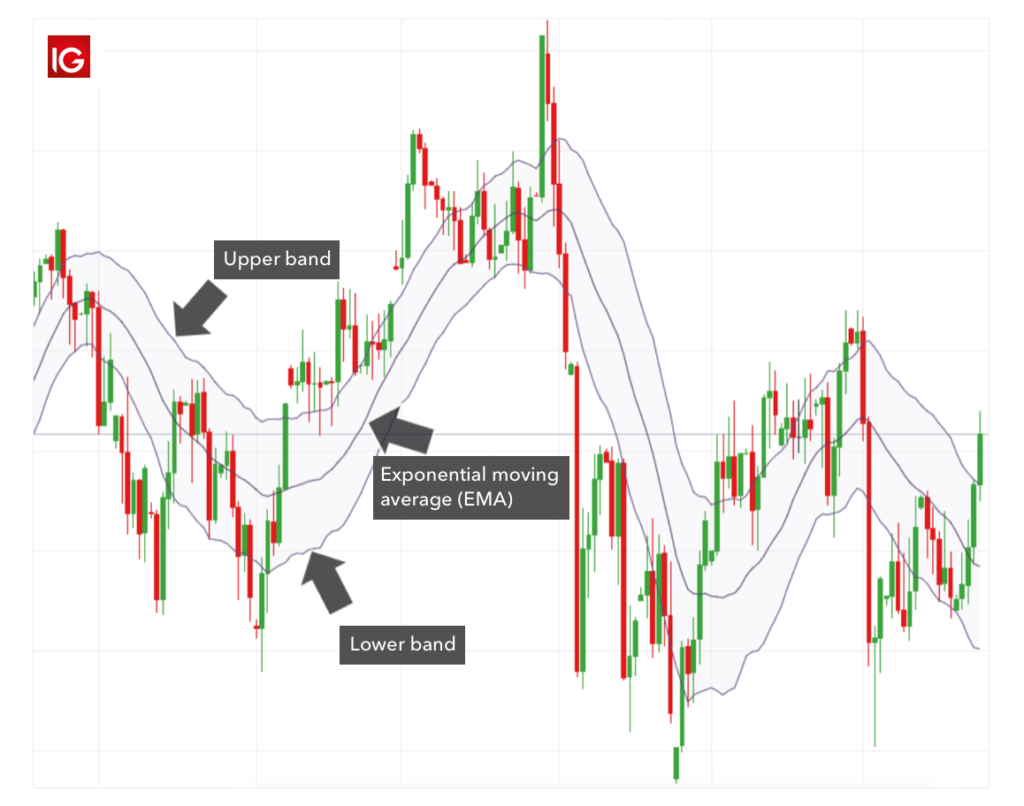
The Keltner Channel consists of three separate lines. The middle line is an exponential moving average (EMA)Exponential Moving Average (EMA)The Exponential Moving Average (EMA) is a technical indicator used in trading practices that shows how the price of an asset or security changes over a of the price and is similar to Keltner’s original centerline. Other lines are placed above (the upper band) and below (the lower band) the EMA and are usually set two times of the Average True Range (ATR).
The EMA is usually collected across 20 periods, contrasting to Keltner’s initial 10-day moving average. The formulas for these will be discussed in detail below, but the upper and lower bands expand and contract as the volatilityVolatilityVolatility is a measure of the rate of fluctuations in the price of a security over time. It indicates the level of risk associated with the price changes of a security. Investors and traders calculate the volatility of a security to assess past variations in the prices does so.
It is common for most price action to take place between the upper and lower bands (known as the channel), so any extraneous activity will be scrutinized, as it likely represents trend changes or a larger phenomenon.
The channel’s direction or angle helps identify the direction of trends; when the channel is upwards, the price is rising, and when the channel is angled downwards, the price is falling.
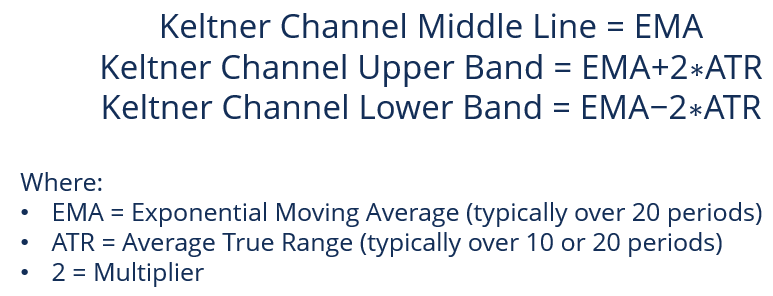
Keltner Channel Formulas
The formulas below are important in knowing the components of the Keltner Channel:
How to Calculate Keltner Channels
- Select the length for the asset, which is typically 20 periods but may be altered before calculating the EMA.
- Calculate the Average True Range (ATR) after the number of periods has been selected (again, usually 20 but may change).
- Choose the multiplier for the ATR. This is usually two but may also be altered.
- Multiply the ATR by the multiplier (typically two) and then add the resulting value to the EMA to find the value of the upper band.
- Multiply the ATR by the desired multiplier (typically two) and subtract the value from the EMA in order to find the value of the lower band.
Uses of the Keltner Channel
The Keltner Channel is used to analyze changes in price action, and it is designed so that any moves above or below the upper and lower bands (or channel lines) are relatively rare and require increased scrutiny.
Trends in the Keltner Channel often start with strong moves in either direction, with surges above the upper band, indicating unusual strength and the opposite indicating unusual weakness.
Strong moves such as these would typically signal the end of one trend and the beginning of another. However, there are also times where strong trends do not take hold after a channel breakout, and the prices only stay within the channel lines, indicated by rather flat moving averages.
As mentioned earlier, the time period chosen for the EMA is typically 20 periods but may be altered. A longer EMA indicates more lag, meaning that the channels do not respond as quickly to price changes.
Shorter EMAs means that the bands react quickly to price changes but may mean that the direction may be faulty if it changes frequently.
The multiplier for the ATR is also at the discretion of the user. Still, a larger multiplier means that the channels will be larger and the possibility of the prices hitting the upper or lower bands will be smaller. In contrast, smaller multipliers indicate that the bands are reached quite often.
Learn More
CFI is the official provider of the global Capital Markets & Securities Analyst (CMSA)®Program Page - CMSAEnroll in CFI's CMSA® program and become a certified Capital Markets &Securities Analyst. Advance your career with our certification programs and courses. certification program, designed to help anyone become a world-class financial analyst. To keep advancing your career, the additional CFI resources below will be useful:
- Technical Analysis – A Beginner’s GuideTechnical Analysis - A Beginner's GuideTechnical analysis is a form of investment valuation that analyses past prices to predict future price action. Technical analysts believe that the collective actions of all the participants in the market accurately reflect all relevant information, and therefore, continually assign a fair market value to securities.
- Donchian ChannelsDonchian ChannelsDonchian Channels are a channel-based technical analysis trading strategy used as an indicator for trading in financial markets.
- Average True RangeAverage True RangeThe average true range (ATR) is a price volatility indicator showing the average price variation of assets within a given time period.
- Moving AverageMoving AverageA moving average is a technical indicator that market analysts and investors may use to determine the direction of a trend. It sums up the data points
-
K-Ratio Explained: Measuring Investment Growth & Consistency
The K-Ratio is a statistical tool that helps us measure two things – the growth of return and the consistency of that growth over a specified period. It is often used to determine the risk vs. r
-

Kelly Criterion: A Guide to Optimal Betting & Investment Strategy
Kelly criterion is a mathematical formula for bet sizing, which is frequently used by investors to decide how much money they should allocate to each investment or bet through a predetermined fraction
invest
- Understanding the Investment Accumulation Phase: Building Wealth Over Time
- Understanding Ascending Channels: A Technical Analysis Guide
- Bandwagon Effect: Understanding Social Influence & Conformity
- Understanding the Call Market: Trading Hours & Price Determination
- Dow 30 Explained: Understanding the Dow Jones Industrial Average
- Understanding Horizontal Channels in Trading: A Comprehensive Guide
- Rule of 72: Calculate Investment Doubling Time | [Your Brand Name]
- Trading Channels: Understanding Uptrends & Downtrends
- Nifty 50: History, Significance & Key Stocks - A Comprehensive Guide
-
 Understanding the January Effect: Stock Market Trends & Causes
The January Effect is known to be a seasonal increase in stock prices throughout the month of January. The increase in demand for stocks is often preceded by a decrease in price during the month of De...
-
 Understanding the Joseph Effect: Trends vs. Randomness
The Joseph Effect, which derives its name from a Biblical reference, is a phrase created by Benoit Mandelbrot, a Polish-born French-American mathematician. The phrase asserts that variations over time...