Understanding Market Depth: A Guide for Traders
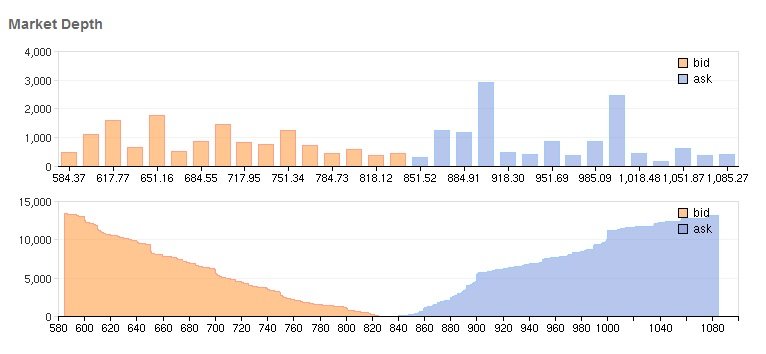
Market depth refers to the ability of the market to sustain a substantially larger order without making an impact on the security’s market price. Usually, while calculating market depth, trading within one particular security is considered. Within the trades, the total breadth and the level of open orders made are considered.
Market depth also refers to the number of shares of a given company that may be purchased without creating a significant level of price appreciation of that particular stock. Usually, no notable price movements are observed while purchasing shares of a company with an extremely liquidLiquidityIn financial markets, liquidity refers to how quickly an investment can be sold without negatively impacting its price. The more liquid an investment is, the more quickly it can be sold (and vice versa), and the easier it is to sell it for fair value. All else being equal, more liquid assets trade at a premium and illiquid assets trade at a discount. stock and with a large number of buyers and sellers at any given time. In such a situation, it is said that the market for that particular stock is deep, owing to a large number of pending orders that are yet to be executed.
Summary
- Market depth refers to the ability of the market to sustain a substantially larger order without making an impact on the security’s market price.
- It also refers to the number of shares of a given company that may be purchased without creating a significant level of price appreciation of the particular stock.
- Market depth shares a close relation to the volume of trade of a security and the associated liquidity.
Market Depth and Volume
Market depth shares a close relation to the volume of tradeVolume of TradeVolume of trade, also known as trading volume, refers to the quantity of shares or contracts that belong to a given security traded on a daily basis of a particular security and the associated liquidity. However, it is important to note that a high trade volume implies that a security demonstrates good market depth. Volatility in the market can be created due to large enough imbalances of orders, and it is fairly common even for shares with generally high volumes of trade on a daily basis.
In major exchangesNew York Stock Exchange (NYSE)The New York Stock Exchange (NYSE) is the largest securities exchange in the world, hosting 82% of the S&P 500, as well as 70 of the biggest in the US, ticks were decimalized, which led to an increase in the overall market depth. In the past, market makers were needed to prevent imbalances in orders, but decimalization‘s nullified any need for the same.
How is Market Depth Expressed?
Usually, an electronic list of buy orders and sell orders that is organized according to price levels is maintained at exchanges. It is the form in which market depth exists, and generally, trading platforms offer market depth displays to the public.
In other instances, the data can be purchased in exchange for a fee. Thus, every single party to a given trade can access a list of the buy and sell orders that are pending execution, which is updated by the trading platform in real-time.
The orders that are considered while evaluating market depth are maintained in the limit order book. It refers to the amount that is to be traded for a particular limit order with a predetermined price or a favorable price for a given size. The predetermined price is not subject to any limits in terms of price. A future change in price is not included in market depth, even though it is probably going to attract more orders.
What Does Market Depth Imply?
Data about market depth enables traders to determine the directions of the price movement of a particular security. Securities that are deep or with a strong market depth allow traders to place bulk orders without creating significant price movements. Contrarily, securities with poor market depth can fluctuate subject to the volume of orders placed.
The data also enables a trader to use short-term price volatility to their advantage and profit from it. Usually, when a company launches an initial public offering (IPO)Initial Public Offering (IPO)An Initial Public Offering (IPO) is the first sale of stocks issued by a company to the public. Prior to an IPO, a company is considered a private company, usually with a small number of investors (founders, friends, family, and business investors such as venture capitalists or angel investors). Learn what an IPO is, traders know that there would be a huge demand for buy orders.
Practical Example
Consider a situation where a trader can access the buy and sell offers for the stock of company Alpha. Currently, stock Alpha is trading at a price of $10. However, there are about 300 offers pending. One hundred of the offers are at $11, 50 are at $12, 100 at $13, and another 50 at $15. There are also 50 other offers – 25 of which are at $8, and 25 are at $7.50.
By looking at the given data, the trader can infer that the price of stock Alpha is going to go up. They can then use the information to make decisions about buying or selling securities in the company.
Additional Resources
CFI is the official provider of the global Commercial Banking & Credit Analyst (CBCA)™Program Page - CBCAGet CFI's CBCA™ certification and become a Commercial Banking & Credit Analyst. Enroll and advance your career with our certification programs and courses. certification program, designed to help anyone become a world-class financial analyst. To keep advancing your career, the additional CFI resources below will be useful:
- Investing: A Beginner’s GuideInvesting: A Beginner's GuideCFI's Investing for Beginners guide will teach you the basics of investing and how to get started. Learn about different strategies and techniques for trading
- Market BasketMarket BasketMarket basket refers to a bundle or group of products that can be indicators of the overall performance of a specific industry, sector, or market segment.
- Moving AverageMoving AverageA moving average is a technical indicator that market analysts and investors may use to determine the direction of a trend. It sums up the data points
- Trade OrderTrade OrderPlacing a trade order seems intuitive – a “buy” button to initiate a trade and a “sell” button to close a trade.
-

Understanding Algorithmic Trading Spoofing: Definition & Impact
Spoofing is a disruptive algorithmic trading practice that involves placing bids to buy or offers to sell futures contractsFutures ContractA futures contract is an agreement to buy or sell an underlyi
-

Trading Volume: Understanding & Significance
The term “volume” in trading refers to the total number of shares that are traded during a given period of time. The volume of trade is measured on all types of financial commodities, incl
invest
- Understanding Auction Markets: How Prices Are Determined
- Depth of Market (DOM): Understanding Real-Time Order Book Data
- Doji Candlestick Pattern: Meaning & Trading Signals
- Understanding Frothy Markets: Risks & Opportunities
- Understanding Inefficient Markets: Causes & Implications
- Understanding Market Cycles: Trends & Economic Environments
- Understanding Market Exposure: Risk & Portfolio Allocation
- Understanding Market Indexes: A Comprehensive Guide
- Understanding Market Makers: How They Fuel Liquidity
-
 Understanding Secular Markets: Long-Term Trends & Investment Strategies
A secular market is predominantly driven and impacted by elements or forces that are likely to be present in the foreseeable future. The forces can impact the price or value of a financial assetFinanc...
-
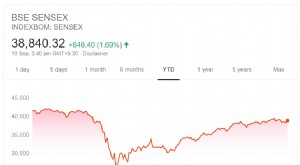 Sensex Explained: Understanding India's Key Stock Market Index
Sensex, also known as the S&P BSE Sensex Index, is the benchmark index that tracks India’s Bombay Stock Exchange (BSE). The Sensex is composed of the 30 largest and most-traded stocks within...