Trading Volume: Understanding & Significance
The term “volume” in trading refers to the total number of shares that are traded during a given period of time. The volume of trade is measured on all types of financial commodities, including stocks, options contracts, bonds, futures contractsFutures ContractA futures contract is an agreement to buy or sell an underlying asset at a later date for a predetermined price. It’s also known as a derivative because future contracts derive their value from an underlying asset. Investors may purchase the right to buy or sell the underlying asset at a later date for a predetermined price., etc.

In trading terminology, when a security is traded for another, it is referred to as a “change of hands.” Hence, volume (in trading) refers to the total quantity of stocks that changed hands for another commodity over a specific period of time. The change of hands can be in reference to an individual stock, a consolidated group of stocks, or with the entire market under consideration.
Indication of Liquidity
Trade volume is a heavily used metric in the trading world. It is because it serves as an indication of the liquidityLiquidityIn financial markets, liquidity refers to how quickly an investment can be sold without negatively impacting its price. The more liquid an investment is, the more quickly it can be sold (and vice versa), and the easier it is to sell it for fair value. All else being equal, more liquid assets trade at a premium and illiquid assets trade at a discount. of the corresponding commodity or financial asset. The level of liquidity indicates the smoothness and swiftness of the buying or selling process of the commodity in question, as the market tends to be a highly volatile one. Hence, trade volume is used as an indication of liquidity to be able to determine how easily and how quickly they can opt in or out of a position with the current prevailing price.
Volume in Trading
Volume in trading indicates the market interest (or lack thereof) in a particular stock or commodity.
1. Higher trade volume
When the trade volume for a particular stock or commodity is relatively higher, it indicates that the overall market interest for that commodity is high and that it is being actively traded in. A higher trade volume for a specific security implies higher liquidity of that security.
Higher liquidity makes the security more sought after, and hence the overall market interest for that security rises, which leads to it being actively traded in. It determines the high volatility in the market. Hence, an overall market interest increase implies that a higher volume means increased buy orders.
2. Lower trade volume
When the trade volume for a particular stock or commodity is relatively lower, it indicates that the overall market interest for that commodity is low and that it is less actively traded in (or not sought after). A lower trade volume for a specific security implies lower liquidity of that security.
Low liquidity indicates less market interest in the particular commodity, which, in turn, implies that it is being less actively traded in. Hence, an overall decline in market interest and volatilityVolatilityVolatility is a measure of the rate of fluctuations in the price of a security over time. It indicates the level of risk associated with the price changes of a security. Investors and traders calculate the volatility of a security to assess past variations in the prices indicates that the market is leaning towards the option to sell.
Exhausting Moves
Exhaustion moves in the trading market happen when there are sharp movements in the security prices accompanied by a sharp increase in trade volume. The market movement is referred to as an exhaustion move because the change indicates the “exhaustion” of a current market trend with respect to a security, signaling towards a potential end of a market trend.
The potential signal towards the end of a prevailing market trend creates an alarming atmosphere in the market, leading investors to opt in or out of their holding positions. It, in turn, induces market volatility and increases the market trade volume.
Additional Resources
CFI is the official provider of the Financial Modeling and Valuation Analyst (FMVA)™Become a Certified Financial Modeling & Valuation Analyst (FMVA)®CFI's Financial Modeling and Valuation Analyst (FMVA)® certification will help you gain the confidence you need in your finance career. Enroll today! certification program, designed to transform anyone into a world-class financial analyst.
In order to help you become a world-class financial analyst and advance your career to your fullest potential, these additional resources will be very helpful:
- Investing: A Beginner’s GuideInvesting: A Beginner's GuideCFI's Investing for Beginners guide will teach you the basics of investing and how to get started. Learn about different strategies and techniques for trading
- Shareholder BaseShareholder BaseShareholder base refers to the total number of shareholders in a company. In other words, it is a base of owners (investors) of a company that holds a
- Trade OrderTrade OrderPlacing a trade order seems intuitive – a “buy” button to initiate a trade and a “sell” button to close a trade.
- Weighted Average Shares OutstandingWeighted Average Shares OutstandingWeighted average shares outstanding refers to the number of shares of a company calculated after adjusting for changes in the share capital over a reporting period. The number of weighted average shares outstanding is used in calculating metrics such as Earnings per Share (EPS) on a company's financial statements
-
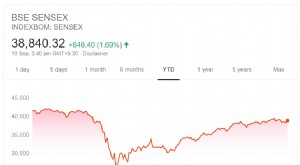
Sensex Explained: Understanding India's Key Stock Market Index
Sensex, also known as the S&P BSE Sensex Index, is the benchmark index that tracks India’s Bombay Stock Exchange (BSE). The Sensex is composed of the 30 largest and most-traded stocks within
-

Understanding Algorithmic Trading Spoofing: Definition & Impact
Spoofing is a disruptive algorithmic trading practice that involves placing bids to buy or offers to sell futures contractsFutures ContractA futures contract is an agreement to buy or sell an underlyi
invest
- Understanding Stock Market Volume: A Comprehensive Guide
- Understanding Auction Markets: How Prices Are Determined
- Doji Candlestick Pattern: Meaning & Trading Signals
- Understanding Frothy Markets: Risks & Opportunities
- Understanding Inefficient Markets: Causes & Implications
- Understanding Market Cycles: Trends & Economic Environments
- Understanding Market Depth: A Guide for Traders
- Understanding Market Exposure: Risk & Portfolio Allocation
- Understanding Market Indexes: A Comprehensive Guide
-
 Understanding Stock Rallies: Definition & What Causes Them
A rally refers to a period of continuous increase in the prices of stocks, indexes or bondsBondsBonds are fixed-income securities that are issued by corporations and governments to raise capital. The ...
-
 Understanding Secular Markets: Long-Term Trends & Investment Strategies
A secular market is predominantly driven and impacted by elements or forces that are likely to be present in the foreseeable future. The forces can impact the price or value of a financial assetFinanc...