Technical Indicators: A Comprehensive Guide for Traders
A technical indicator is a mathematical pattern derived from historical data used by technical traders or investors to predict future price trends and make trading decisions. It uses a mathematical formula to derive a series of data points from past price, volume, and open interest data.
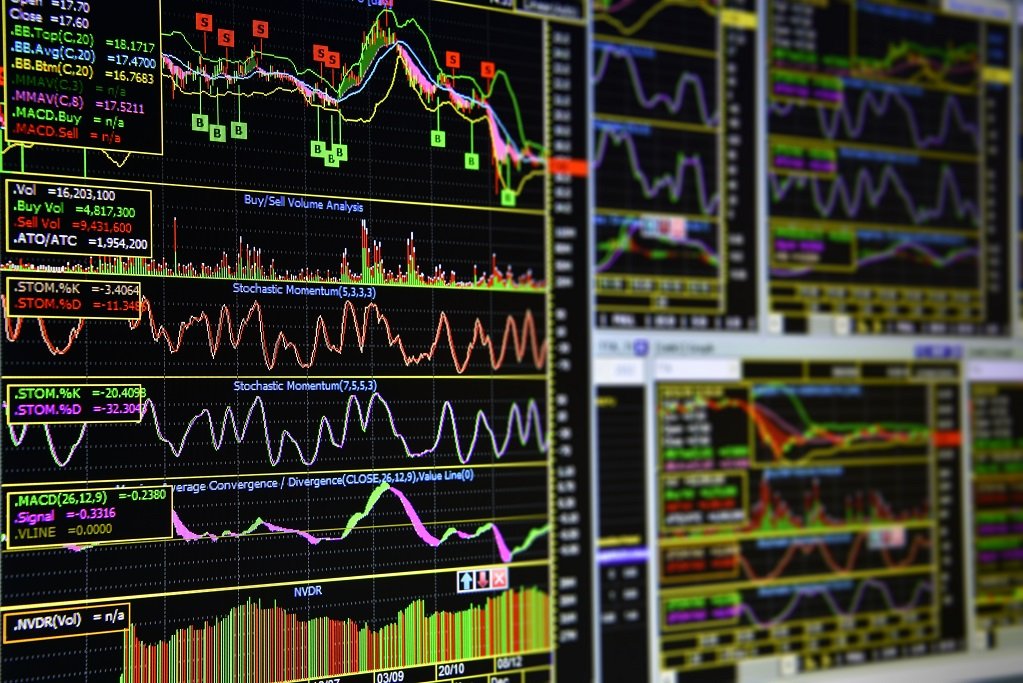
A technical indicator is usually shown graphically and compared with the corresponding price chart for analysis. The mechanics of a technical indicator captures the behavior and sometimes the investors’ psychology to provide a clue of future trends of price activity.
Technical indicators offered in technical analysis to predict future price movements include cycle volumes, momentum readings, volume patterns, price trends, Bollinger BandsBollinger Bands®"Bollinger Bands" are a technical analysis tool developed by John Bollinger in the 1980s for trading stocks. The bands comprise a volatility indicator that measures the relative high or low of a security's price in relation to previous trades., moving average, Elliot waves, oscillators, and sentiment indicators. Besides providing valuable insight into the price structure, a technical indicator also shows how to reap potential profits from price movements.
Summary
- In technical analysis, a technical indicator is mathematically derived from price, trading volume, investor sentiments, or open interest data and applied to interpret stock market trends and investment decisions using past price and volume trends.
- Technical analysts use technical indicators to determine market entry and exit points.
- Technical indicators can be used for trading decisions by analyzing them either on a stand-alone basis or when combined.
Understanding Technical Indicators
A technical indicator is generally a mathematically derived representation of data, such as price, volume, or open interest, to detect stock movement. The indicator is weighed based on historically-adjusted returns, common sense, an investor’s objective, and logic to evaluate investments and identify trading opportunities.
Some technical indicators generate signals as stand-alone, while others supplement each other. As elements of technical analysisTechnical Analysis - A Beginner's GuideTechnical analysis is a form of investment valuation that analyses past prices to predict future price action. Technical analysts believe that the collective actions of all the participants in the market accurately reflect all relevant information, and therefore, continually assign a fair market value to securities., they are used to evaluate a security’s strength or weakness by focusing on trading signals, patterns or price movements, and other analytical charting tools. Although there are non-specific technical indicators with regard to the market, some technical indicators are meant to be used for a specific financial market.
Types of Technical Indicators
1. Oscillators
Oscillators are a special subset of technical indicators that oscillates between a local minimum and maximum and focuses on market momentum. They are best used to provide readings of overbought and oversold price movements. Traders and investors define price turns and reversals within ranging markets using oscillators because they swing within a generally defined range.
In many cases, technical analysts consider using multiple oscillators on a single chart as redundant because they bear a striking similarity in their mathematical formulas, function, and appearance. Technical analysis uses oscillators, such as relative strength.
2. Overlays
Overlays are special types of technical indicators used by traders and investors to identify overbought and oversold levels. They provide insight into the supply and demand of a stock. Commonly used overlays include Bollinger Bands and moving averageMoving AverageA moving average is a technical indicator that market analysts and investors may use to determine the direction of a trend. It sums up the data points.
Other than giving the overbought and oversold conditions, Bollinger Bands measure the impending market volatility. On the other hand, moving averages are used to determine and measure the strength of a market trend.
Common Technical Indicators
1. Accumulation/Distribution Line (A/D Line)
The Accumulation/Distribution Line is commonly used to determine a security’s money flow. The A/D line focuses only on the security’s closing price and trading range for the period. A buying interest is shown when the indicator line is trending up, while a falling indicator line shows a downtrend.
2. On-Balance-Volume (OBV)
On-Balance-Volume (OBV)On-Balance Volume Indicator (OBV)On-Balance Volume Indicator (OBV) refers to a technical indicator of momentum that utilizes the positive or negative flow of the volume of applies to securities over time, where it measures the flow of trading volume. A rising OBV suggests the buyers’ willingness to enter the market. Conversely, a falling OBV suggests lower prices when selling volume outpaces buying volume. OBV is, therefore, a confirmation indicator for a continuous trend.
3. Average Direction indicator (ADX)
Traders and investors use the Average Direction indicator (ADX) to measure a trend’s strength and momentum. A robust direction strength, either up or down, is in the offing when the ADX is above 40. A weak trend or non-trending is suggestive when the indicator is below 20.
4. Moving Average Convergence Divergence (MACD)
Traders use Moving Average Convergence Divergence (MACD) to see the direction and momentum of a trend that provides different trade signals. When the price is on an upward phase, the MACD is above zero, while a below-zero MACD is suggestive of a bearish period.
Combining Multiple Technical Indicators
Technical analysts analyze technical indicators independently to perceive possible changes in the behavior of each indicator. The structural changes within the various financial markets render the behavior of some technical indicators substantial.
For this reason, there are overwhelming combinations of technical indicators. Some combinations are complex to understand and work with, while other combinations prove easy, especially when weights are assigned to each indicator.
An example of a technical indicator combination is the Commodex Trend Index. The Commodex Trend Index incorporates other subjective forms of technical analysis, such as crossovers of a fast and slow-moving average, liquidation, open interest, and volume momentum.
More Resources
CFI is the official provider of the Capital Markets & Securities Analyst (CMSA)®Program Page - CMSAEnroll in CFI's CMSA® program and become a certified Capital Markets &Securities Analyst. Advance your career with our certification programs and courses. certification program, designed to transform anyone into a world-class financial analyst.
To keep learning and developing your knowledge of financial analysis, we highly recommend the additional resources below:
- Advanced Technical AnalysisAdvanced Technical AnalysisAdvanced technical analysis usually involves using either multiple technical indicators or a rather sophisticated (i.e., complex) indicator. "Sophisticated"
- MACD OscillatorMACD Oscillator - Technical AnalysisThe MACD Oscillator is used to examine short-term moving average convergence and divergence. The MACD Oscillator is a double-edged technical indicator in that it offers traders and analysts the ability to follow trends in the market, as well as gauge the momentum of price changes.
- Volume of TradeVolume of TradeVolume of trade, also known as trading volume, refers to the quantity of shares or contracts that belong to a given security traded on a daily basis
- How to Read Stock ChartsHow to Read Stock ChartsIf you’re going to actively trade stocks as a stock market investor, then you need to know how to read stock charts. Even traders who primarily use fundamental analysis to select stocks to invest in still often use technical analysis of stock price movement to determine specific buy and sell, stock charting
-

Understanding Call Prices: Callable Bonds & Preferred Stocks
A call price refers to the price that a preferred stock or bond issuer would pay to buyers if they chose to redeem the callable security before the maturity date. The price is set during the issuance
-

Call Warrants: Understanding Rights & Investment Potential
A call warrant gives the holder of the investment the right, not the obligation, to purchase the underlying financial securities at a specific price on or before a certain date.If the holder does not
invest
- Understanding Divergence in Technical Analysis: A Guide
- Understanding Forward Prices: Definition & How They Work
- Understanding Hedging Strategies: A Comprehensive Guide
- On-Balance Volume (OBV): Understanding Trading Momentum
- Understanding Slippage in Trading: Causes & Impact
- Understanding Strangle Options: A Comprehensive Guide
- Technical Analysis: A Comprehensive Guide to Predicting Stock Prices
- Technical Correction: Definition, Causes & Examples
- Understanding Volatility: A Key Indicator of Investment Risk
-
 Understanding Ascending Channels: A Technical Analysis Guide
An ascending channel occurs when visually analyzing an overall uptrend in the asset price of a stockStockWhat is a stock? An individual who owns stock in a company is called a shareholder and is eligi...
-
 Call Options: A Comprehensive Guide for Investors
A call option, commonly referred to as a “call,” is a form of a derivatives contract that gives the call option buyer the right, but not the obligation, to buy a stockStockWhat is a stock?...