On-Balance Volume (OBV): Understanding Trading Momentum
On-Balance Volume Indicator (OBV) refers to a technical indicator of momentum that utilizes the positive or negative flow of the volume of trading to reflect the relative buying and selling pressure on a financial assetFinancial AssetsFinancial assets refer to assets that arise from contractual agreements on future cash flows or from owning equity instruments of another entity. A key, with the aim of predicting the probable direction of near-term price changes. In other words, OBV tracks increasing or decreasing volume to project future price movements.
OBV was created by Joseph Granville in the early 1960s and elucidated in his book, “Granville’s New Key to Stock Market Profits.” Granville argued that volume is a key determinant and, therefore, a reliable predictor of stock price movements.
While he only applied his new volume indicator to the analysis of stocks, it has since been used by traders in other financial trading markets, such as commodity futures and forex trading5-Step Guide to Winning Forex TradingHere are the secrets to winning forex trading that will enable you to master the complexities of the forex market. The forex market is the largest market in the world in terms of the dollar value of average daily trading, dwarfing the stock and bond markets..
Summary
- On-Balance Volume Indicator (OBV) refers to a technical indicator of momentum that utilizes the positive or negative flow of the volume of trading to reflect the relative buying and selling pressure on a financial asset.
- The aim of monitoring the OBV is to predict the probable direction of near-term price changes.
- The divergence between the OBV indicator and the current price trend often signals an impending trend change.
Formula for Calculating On-Balance Volume
You use one of three possible calculations to get the current on-balance volume, the choice of which depends on the closing price of the traded financial asset (such as stock).
(Because OBV is a cumulative indicator – the running total of positive volume and negative volume – the calculation begins with a selected starting value of the OBV at a previous point in time – i.e., the OBV at the close of the previous trading day).
If the closing price of the asset is higher than the previous day’s closing price:
OBV = Previous OBV + Current Day’s Volume
If the closing price of the asset is the same as the previous day’s closing price:
OBV = Previous OBV (+ 0)
If the closing price of the asset is lower than the previous day’s closing price:
OBV = Previous OBV – Current Day’s Volume
By adding volume to the running OBV total on days when a security’s price goes up and subtracting the day’s volume on down days in price, the trend of on-balance volume – whether the total is rising or declining – should typically mirror the current price trend.
However, when the OBV indicator makes a significant move without an accompanying move in price or in the opposite direction of price, traders begin to anticipate a possible trend change in price to emerge soon.
It is not necessary to manually calculate the on-balance volume day to day. You can simply load the on-balance volume indicator onto a stock chart. The absolute numerical values of the OBV at any given point in time are not considered as important as the OBV’s general directional movement, which is easily indicated with a chart line.
Using the On-Balance Volume Indicator
According to Granville, changes in volume – both in the amount of volume and in the trend of volume (that is, whether the daily trading volume is generally increasing or decreasing) – are often a leading indicator of changes in a stock’s price.
In other words, traders monitoring the on-balance volume in stock can expect to see a trend of increasing volume often arise before an uptrend in the stock price begins. Conversely, a falling volume trend is interpreted as a signal that the stock price itself is likely to enter a corresponding downtrend soon.
Granville also theorized that if volume begins to markedly increase or decrease while the stock price remains relatively flat, the pressure of greater amounts of buying or selling was likely to eventually result in a very sharp price move to the upside or downside – rather like blowing the lid off a pot of boiling water.
Many traders simply use the on-balance volume indicator as a confirming technical indicator of a stock’s price trend. For example, when a stock is steadily rising in price, traders monitoring the on-balance volume indicator will expect to see it rising as well.
As with other momentum indicators, such as the MACDMACD Oscillator - Technical AnalysisThe MACD Oscillator is used to examine short-term moving average convergence and divergence. The MACD Oscillator is a double-edged technical indicator in that it offers traders and analysts the ability to follow trends in the market, as well as gauge the momentum of price changes., higher levels of the OBV indicator’s stronger momentum reinforces the current price trend. When the OBV diverges from the direction of a security’s price movement, it may be an early indicator of a pending trend change.
For example, if a stock’s price continues to rise, but the on-balance volume indicator begins to decline, that may be interpreted that the previous buying momentum in the stock is beginning to wane. The stock price may soon peak and turn to the downside.
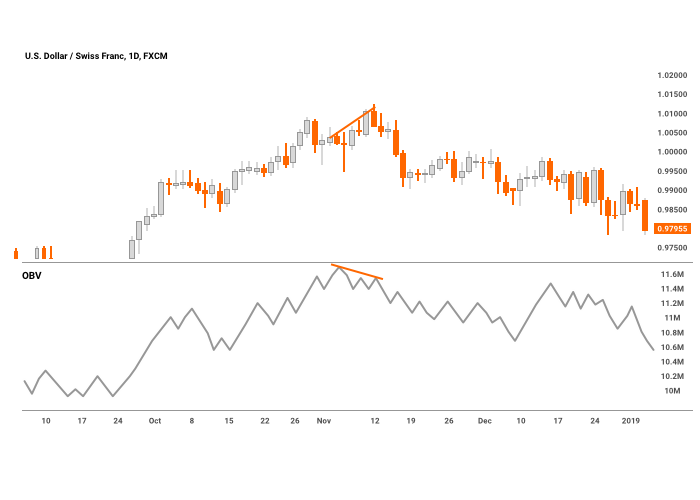
The chart below shows an instance of divergence with the on-balance volume indicator. Marked with orange lines in about the middle of the chart, you can see where price continues to rise to a new high while the OBV indicator (shown in the lower chart window) turns to the downside with a decline in volume.
The divergence correctly presaged a price turn from an uptrend to a downtrend that followed about a week after the on-balance volume trend turned downward. From that point forward, the continued decline in OBV confirmed the ongoing downtrend in price.
Related Readings
CFI offers the Capital Markets & Securities Analyst (CMSA)®Program Page - CMSAEnroll in CFI's CMSA® program and become a certified Capital Markets &Securities Analyst. Advance your career with our certification programs and courses. certification program for those looking to take their careers to the next level. To keep learning and advancing your career, the following resources will be helpful:
- Adjusted Closing PriceAdjusted Closing PriceThe adjusted closing price is a calculation adjustment made to a stock’s closing price. The original closing price is the final price in which a stock, or
- Momentum indicatorsMomentum IndicatorsMomentum indicators are tools utilized by traders to get a better understanding of the speed or rate at which the price of a security changes. Momentum
- Average Daily Trading Volume (ADTV)Average Daily Trading Volume (ADTV)Average Daily Trading Volume (ADTV) is a technical indicator used by investors that refers to the number of shares of a particular stock that
- Volume Price Trend Indicator (VPT)Volume Price Trend Indicator (VPT)The Volume Price Trend Indicator (VPT) is a stock market indicator that helps traders relate a stock's price and trading volume.
-

Understanding Quoted Prices: A Comprehensive Guide
The quoted price is the most recent – or last – price at which a financial assetFinancial AssetsFinancial assets refer to assets that arise from contractual agreements on future cash flows
-
Slow Stochastic Indicator: Definition, Calculation & Interpretation
The slow stochastic indicator is a technical momentum indicator that aims to measure the trend in prices and identify trend reversals. George Lane developed the indicator, which is driven by two param
invest
- Accumulation/Distribution (A/D) Indicator: A Comprehensive Guide
- Arms Index (TRIN): Understanding Short-Term Market Sentiment
- Black-Scholes Model: Understanding Stock Option Pricing
- Net Volume Explained: Understanding Market Sentiment
- On-Balance Volume (OBV): Understanding Trading Momentum
- Technical Indicators: A Comprehensive Guide for Traders
- Volume Analysis: A Comprehensive Guide for Traders & Investors
- Volume Price Trend Indicator (VPT): A Comprehensive Guide
- Vortex Indicator (VI): A Comprehensive Guide for Trend Analysis
-
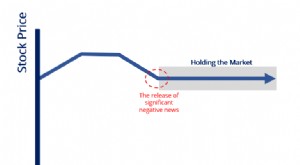 Understanding Market Support: What is 'Holding the Market'?
Holding the market refers to a market participant (or participants) that places or maintains buy orders for a security whose price is expected to fall rapidly – or is in the process of – t...
-
 Understanding Offering Price: A Guide for Investors
The offering price is the per share price of publicly issued securities set by an underwriter and at which the shares are available for purchase. Although the term is mostly used in the context of the...