Arbitrage Pricing Theory (APT): A Comprehensive Overview
The Arbitrage Pricing Theory (APT) is a theory of asset pricing that holds that an asset’s returnsReturn on Assets & ROA FormulaROA Formula. Return on Assets (ROA) is a type of return on investment (ROI) metric that measures the profitability of a business in relation to its total assets. can be forecasted with the linear relationship of an asset’s expected returns and the macroeconomic factors that affect the asset’s risk. The theory was created in 1976 by American economist, Stephen Ross. The APT offers analysts and investors a multi-factor pricing model for securities, based on the relationship between a financial asset’s expected return and its risks.

The APT aims to pinpoint the fair market price of a security that may be temporarily incorrectly priced. It assumes that market action is less than always perfectly efficient, and therefore occasionally results in assets being mispriced – either overvalued or undervalued – for a brief period of time.
However, market action should eventually correct the situation, moving price back to its fair market value. To an arbitrageur, temporarily mispriced securities represent a short-term opportunity to profit virtually risk-free.
The APT is a more flexible and complex alternative to the Capital Asset Pricing Model (CAPM)Capital Asset Pricing Model (CAPM)The Capital Asset Pricing Model (CAPM) is a model that describes the relationship between expected return and risk of a security. CAPM formula shows the return of a security is equal to the risk-free return plus a risk premium, based on the beta of that security. The theory provides investors and analysts with the opportunity to customize their research. However, it is more difficult to apply, as it takes a considerable amount of time to determine all the various factors that may influence the price of an asset.
Assumptions in the Arbitrage Pricing Theory
The Arbitrage Pricing Theory operates with a pricing model that factors in many sources of risk and uncertainty. Unlike the Capital Asset Pricing Model (CAPM), which only takes into account the single factor of the risk level of the overall market, the APT model looks at several macroeconomic factors that, according to the theory, determine the risk and return of the specific asset.
These factors provide risk premiums for investors to consider because the factors carry systematic riskSystematic RiskSystematic risk is that part of the total risk that is caused by factors beyond the control of a specific company or individual. Systematic risk is caused by factors that are external to the organization. All investments or securities are subject to systematic risk and therefore, it is a non-diversifiable risk. that cannot be eliminated by diversifying.
The APT suggests that investors will diversify their portfolios, but that they will also choose their own individual profile of risk and returns based on the premiums and sensitivity of the macroeconomic risk factors. Risk-taking investors will exploit the differences in expected and real returns on the asset by using arbitrage.
Arbitrage in the APT
The APT suggests that the returns on assets follow a linear pattern. An investor can leverage deviations in returns from the linear pattern using the arbitrage strategy. Arbitrage is the practice of the simultaneous purchase and sale of an asset on different exchanges, taking advantage of slight pricing discrepancies to lock in a risk-free profit for the trade.
However, the APT’s concept of arbitrage is different from the classic meaning of the term. In the APT, arbitrage is not a risk-free operation – but it does offer a high probability of success. What the arbitrage pricing theory offers traders is a model for determining the theoretical fair market value of an asset. Having determined that value, traders then look for slight deviations from the fair market price, and trade accordingly.
For example, if the fair market value of stock A is determined, using the APT pricing model, to be $13, but the market price briefly drops to $11, then a trader would buy the stock, based on the belief that further market price action will quickly “correct” the market price back to the $13 a share level.
Mathematical Model of the APT
The Arbitrage Pricing Theory can be expressed as a mathematical model:

Where:
- ER(x) – Expected return on asset
- Rf – Riskless rate of return
- βn (Beta) – The asset’s price sensitivity to factor
- RPn – The risk premium associated with factor
Historical returns on securities are analyzed with linear regression analysisRegression AnalysisRegression analysis is a set of statistical methods used to estimate relationships between a dependent variable and one or more independent variables. against the macroeconomic factor to estimate beta coefficients for the arbitrage pricing theory formula.
Inputs in the Arbitrage Pricing Theory Formula
The Arbitrage Pricing Theory provides more flexibility than the CAPM; however, the former is more complex. The inputs that make the arbitrage pricing model complicated are the asset’s price sensitivity to factor n (βn) and the risk premium to factor n (RPn).
Before coming up with a beta and risk premium, the investor must select the factors that they believe affect the return on the asset; it can be done through fundamental analysis and a multivariant regression. One method to calculate the beta of the factor is by analyzing how that beta’s affected many similar assets/indices and obtain an estimate by running a regression on how the factor’s affected the similar assets/index.
The risk premium can be obtained by equating the similar assets’/indices’ historical annualized return to the riskless rate, added to the betas of the factors multiplied by the factor premiums, and solve for the factor premiums.
Example
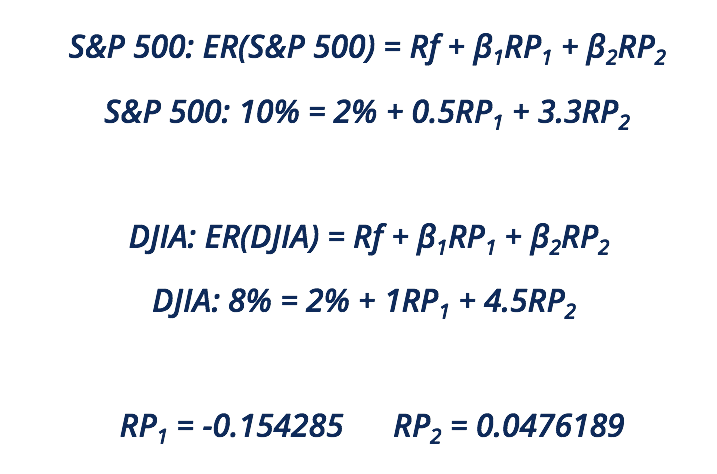
Assume that:
- You want to apply the arbitrage pricing theory formula for a well-diversified portfolio of equities.
- The riskless rate of return is 2%.
- Two similar assets/indices are the S&P 500 and the Dow Jones Industrial Average (DJIA).
- Two factors are inflation and gross domestic product (GDP).
- The betas of inflation and GDP on the S&P 500 are 0.5 and 3.3, respectively*.
- The betas of inflation and GDP on the DJIA are 1 and 4.5, respectively*.
- The S&P 500 expected return is 10%, and the DJIA expected return is 8%*.
*Betas do not represent actual betas in the markets. They are only used for demonstrative purposes.
*Expected returns do not represent actual expected returns. They are only used for demonstrative purposes.
After solving for the risk premiums, we are left with the following for our well-diversified portfolio:
To calculate the expected arbitrage pricing theory return, plug in the regression results of how the betas have affected many similar assets/indices.

Related Readings
CFI is the official provider of the global Commercial Banking & Credit Analyst (CBCA)™Program Page - CBCAGet CFI's CBCA™ certification and become a Commercial Banking & Credit Analyst. Enroll and advance your career with our certification programs and courses. certification program, designed to help anyone become a world-class financial analyst. To keep advancing your career, the additional CFI resources below will be useful:
- Beta CoefficientBeta CoefficientThe Beta coefficient is a measure of sensitivity or correlation of a security or an investment portfolio to movements in the overall market.
- Return on EquityReturn on Equity (ROE)Return on Equity (ROE) is a measure of a company’s profitability that takes a company’s annual return (net income) divided by the value of its total shareholders' equity (i.e. 12%). ROE combines the income statement and the balance sheet as the net income or profit is compared to the shareholders’ equity.
- Equity Risk PremiumEquity Risk PremiumEquity risk premium is the difference between returns on equity/individual stock and the risk-free rate of return. It is the compensation to the investor for taking a higher level of risk and investing in equity rather than risk-free securities.
- Regression AnalysisRegression AnalysisRegression analysis is a set of statistical methods used to estimate relationships between a dependent variable and one or more independent variables.
-

Asset Turnover Ratio: Definition & Importance
Asset turnover is a financial ratio that measures the value of revenueRevenue StreamsRevenue Streams are the various sources from which a business earns money from the sale of goods or provision of se
-
Current Ratio: Definition, Calculation & Financial Health
The current ratio, also known as the working capitalNet Working CapitalNet Working Capital (NWC) is the difference between a companys current assets (net of cash) and current liabilities (net of debt)
finance
- Asset Turnover Ratio: Definition & Calculation - Financial Analysis
- Debt-to-Asset Ratio: Definition, Calculation & Significance
- Dividend Irrelevance Theory: Understanding Its Implications
- Operating Asset Turnover Ratio: Definition & Analysis
- Pecking Order Theory: Understanding Corporate Financing Strategies
- Darvas Box Strategy: A Beginner's Guide to Profitable Trading
- Understanding the Greater Fool Theory: Market Valuation & Irrational Exuberance
- Local Expectations Theory: Understanding Bond Yields & Term Structure
- Understanding the Liquidity Preference Theory: A Comprehensive Explanation
-
 Asset Management: Definition, Types & Importance
Asset management refers to the process of developing, operating, maintaining, and selling assetsTypes of AssetsCommon types of assets include current, non-current, physical, intangible, operating, and...
-
 Modern Portfolio Theory (MPT): Maximize Returns, Minimize Risk
The Modern Portfolio Theory (MPT) refers to an investment theory that allows investors to assemble an asset portfolio that maximizes expected return for a given level of risk. The theory assumes that ...