Understanding the Beta Coefficient: A Guide for Investors
The Beta coefficient is a measure of sensitivity or correlation of a securityMarketable SecuritiesMarketable securities are unrestricted short-term financial instruments that are issued either for equity securities or for debt securities of a publicly listed company. The issuing company creates these instruments for the express purpose of raising funds to further finance business activities and expansion. or an investment portfolio to movements in the overall market. We can derive a statistical measure of risk by comparing the returns of an individual security/portfolio to the returns of the overall market and identify the proportion of risk that can be attributed to the market.
Systematic vs Unsystematic Risk
We can think about unsystematic risk as “stock-specific” risk and systematic risk as “general-market” risk. If we hold only one stock in a portfolio, the return of that stock may vary wildly compared to the average gain or loss of the overall market as reflected by a major stock index such as the S&P 500. However, as we continue adding more to the portfolio, the portfolio’s returns will gradually start more closely resembling the overall market’s returns. As we diversify our portfolio of stocks, the “stock-specific” unsystematic risk is reduced.
Systematic riskSystematic RiskSystematic risk is that part of the total risk that is caused by factors beyond the control of a specific company or individual. Systematic risk is caused by factors that are external to the organization. All investments or securities are subject to systematic risk and therefore, it is a non-diversifiable risk. is the underlying risk that affects the entire market. Large changes in macroeconomic variables, such as interest rates, inflation, GDPGDP FormulaGross Domestic Product (GDP) is the monetary value, in local currency, of all final economic goods and services produced in a country during a, or foreign exchange, are changes that impact the broader market and that cannot be avoided through diversification. The Beta coefficient relates “general-market” systematic risk to “stock-specific” unsystematic risk by comparing the rate of change between “general-market” and “stock-specific” returns.
The Capital Asset Pricing Model (CAPM)
The Capital Asset Pricing ModelCapital Asset Pricing Model (CAPM)The Capital Asset Pricing Model (CAPM) is a model that describes the relationship between expected return and risk of a security. CAPM formula shows the return of a security is equal to the risk-free return plus a risk premium, based on the beta of that security (or CAPM) describes individual stock returns as a function of the overall market’s returns.
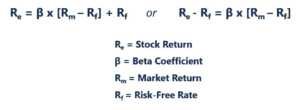
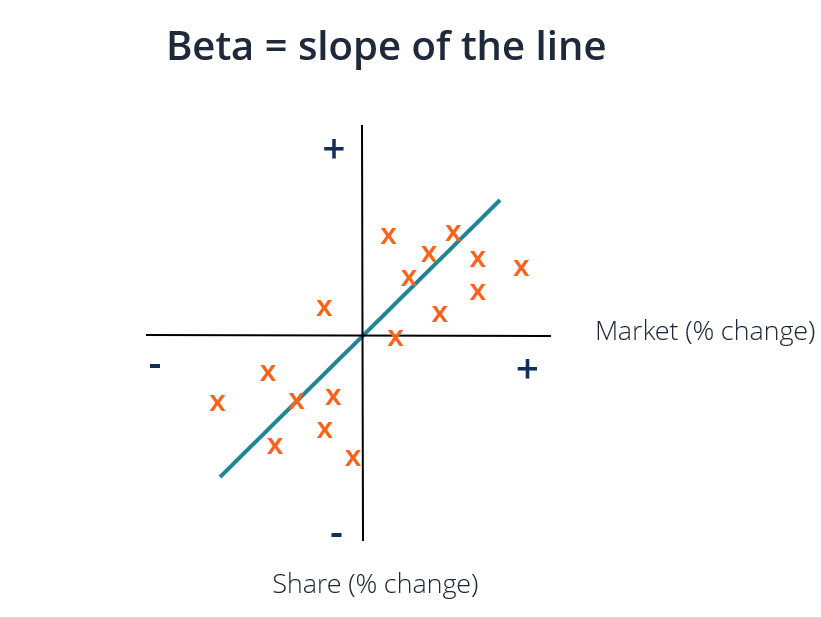
Each of these variables can be thought of using the slope-intercept framework where Re = y, B = slope, (Rm – Rf) = x, and Rf = y-intercept. Important insights to be gained from this framework are:
- An asset is expected to generate at least the risk-free rate of return.
- If the Beta of an individual stock or portfolio equals 1, then the return of the asset equals the average market return.
- The Beta coefficient represents the slope of the line of best fit for each Re – Rf (y) and Rm – Rf (x) excess return pair.
In the graph above, we plotted excess stock returns over excess market returns to find the line of best fit. However, we observe that this stock has a positive intercept value after accounting for the risk-free rate. This value represents Alpha, or the additional return expected from the stock when the market return is zero.
How to Calculate the Beta Coefficient
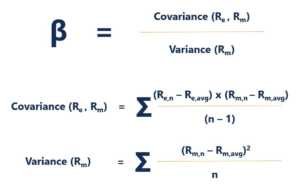
To calculate the Beta of a stock or portfolio, divide the covariance of the excess asset returns and excess market returns by the variance of the excess market returns over the risk-free rate of return:
Advantages of using Beta Coefficient
One of the most popular uses of Beta is to estimate the cost of equity (Re) in valuation models. The CAPM estimates an asset’s Beta based on a single factor, which is the systematic risk of the market. The cost of equity derived by the CAPM reflects a reality in which most investors have diversified portfolios from which unsystematic risk has been successfully diversified away.
In general, the CAPM and Beta provide an easy-to-use calculation method that standardizes a risk measure across many companies with varied capital structures and fundamentals.
Disadvantages of Using Beta Coefficient
The largest drawback of using Beta is that it relies solely on past returns and does not account for new information that may impact returns in the future. Furthermore, as more return data is gathered over time, the measure of Beta changes, and subsequently, so does the cost of equity.
While systematic risk inherent to the market has a meaningful impact in explaining asset returns, it ignores the unsystematic risk factors that are specific to the firm. Eugene Fama and Kenneth French added a size factor and value factor to the CAPM, using firm-specific fundamentals to better describe stock returns. This risk measure is known as the Fama French 3 Factor Model.
Other Resources
CFI offers the Capital Markets & Securities Analyst (CMSA)®Program Page - CMSAEnroll in CFI's CMSA® program and become a certified Capital Markets &Securities Analyst. Advance your career with our certification programs and courses. certification program for those looking to take their careers to the next level. To keep learning and advance your career, the following resources will be helpful:
- Valuation MethodsValuation MethodsWhen valuing a company as a going concern there are three main valuation methods used: DCF analysis, comparable companies, and precedent transactions
- Unlevered BetaUnlevered Beta / Asset BetaUnlevered Beta (Asset Beta) is the volatility of returns for a business, without considering its financial leverage. It only takes into account its assets.
- Weighted Average Cost of CapitalWACCWACC is a firm’s Weighted Average Cost of Capital and represents its blended cost of capital including equity and debt.
- Investing: A Beginner’s GuideInvesting: A Beginner's GuideCFI's Investing for Beginners guide will teach you the basics of investing and how to get started. Learn about different strategies and techniques for trading
-
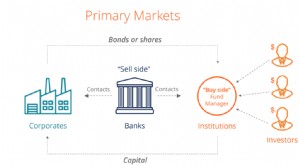
Understanding the Primary Market: A Comprehensive Guide
The primary market is the financial market where new securitiesPublic SecuritiesPublic securities, or marketable securities, are investments that are openly or easily traded in a market. The securitie
-

Understanding the S&P 500: A Comprehensive Guide
The Standard and Poor’s 500 Index, abbreviated as S&P 500 index, is an index comprising the stocks of 500 publicly traded companies in the U.S. with the highest values of market capitalizati
finance
- Interbank Market: A Comprehensive Overview of Foreign Exchange Trading
- Market Risk Premium: Definition & Calculation | Investopedia
- Understanding the Secondary Market: A Guide for Investors
- Understanding Systematic Risk: Factors Beyond Your Control
- Treynor Ratio: Understanding Risk-Adjusted Portfolio Performance
- Understanding Adjusted Beta: A More Accurate Measure of Stock Risk
- Understanding the Call Market: Trading Hours & Price Determination
- Understanding Market Risk: A Comprehensive Guide
- Understanding the Money Market: Short-Term Debt & Lending
-
 Nasdaq Capital Market: A Guide to Small-Cap Investing
The Nasdaq Capital Market is one of the three tiers within the Nasdaq Composite Index. The Capital Market tier is an equity market for companies with the smallest levels of market capitalizationMarket...
-
 NASDAQ Composite: Understanding the US Stock Market Index
The NASDAQ Composite is an index of more than 3,000 common equities listed on the NASDAQ stock market. The index is one of the most followed indices in the United States, alongside the Dow Jones Indus...