Understanding Inverted Yield Curves: Recession Indicator?
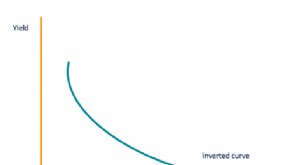
An inverted yield curve often indicates the lead-up to a recession or economic slowdownEconomic DepressionAn economic depression is an occurrence wherein an economy is in a state of financial turmoil, often the result of a period of negative activity based on the country’s Gross Domestic Product (GDP) rate. It is a lot worse than a recession, with GDP falling significantly, and usually lasts for many years.. The yield curve is a graphical representation of the relationship between the interest rate paid by an asset (usually government bondsTreasury Bills (T-Bills)Treasury Bills (or T-Bills for short) are a short-term financial instrument issued by the US Treasury with maturity periods from a few days up to 52 weeks.) and the time to maturity. The interest rate is measured on the vertical axis and time to maturity is measured on the horizontal axis. Normally, interest rates and time to maturity are positively correlated.
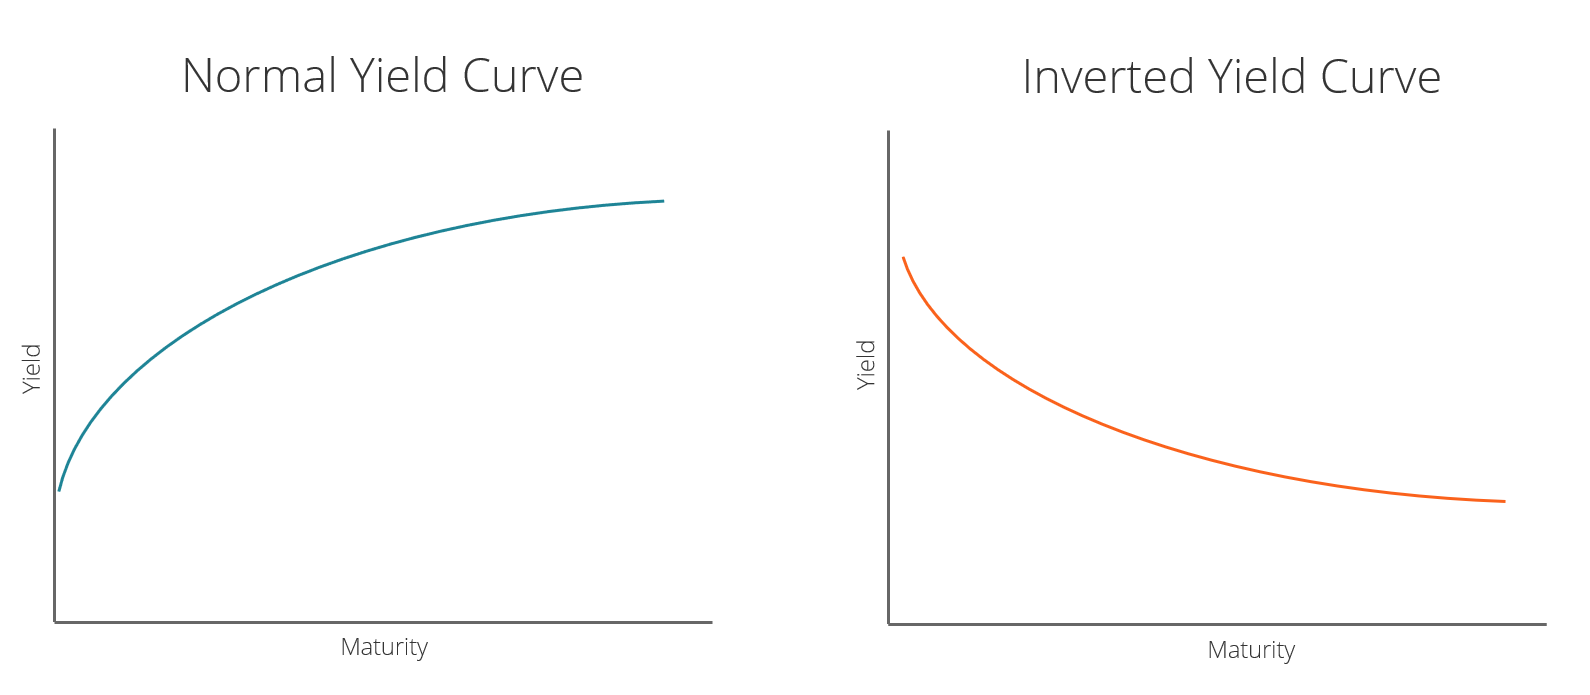
Under normal conditions, interest rates go up with an increase in the time to maturity. This results in a positive slope for the yield curve. If interest rates and time to maturity are negatively correlated, then the resulting inverted yield curve will show a negative slope.
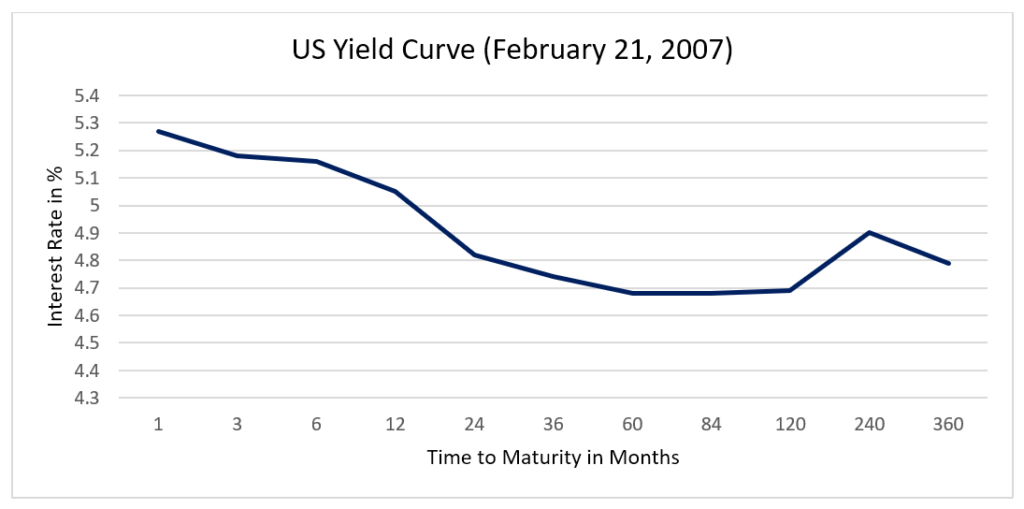
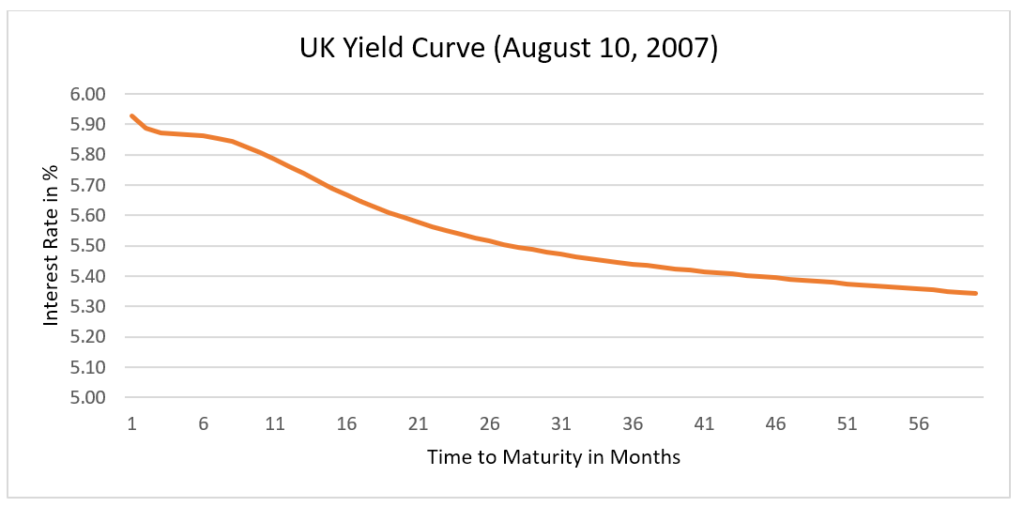
Historically, the yield curve assumes a negative slope in the lead-up to recessions and economic slowdownsEconomic DepressionAn economic depression is an occurrence wherein an economy is in a state of financial turmoil, often the result of a period of negative activity based on the country’s Gross Domestic Product (GDP) rate. It is a lot worse than a recession, with GDP falling significantly, and usually lasts for many years..
Inverted Yield Curve – The Expectation Hypothesis
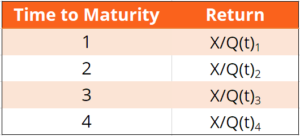
Consider the following example: An N-year government bond costs Q(t)N in period t and pays an amount X in period t+N years. Therefore, the return on a one-year bond is X/Q(t)1. The one-year bond pays X in period t+1.
Consider an investor who does the following:
- Buys a one-year bond now by paying Q(t)1.
- At the end of the year receives X.
- At the end of the year, spends all of X on buying one-year bonds, which will expire at the end of next year.
The return on this sequence of two one-year investments is X/Q(t)1 * X/Q(t+1)1.
If investors are risk neutral, then the return on a two-year bond should be equal to the expected return on a sequence of two one-year bonds. In general, the expected return on N one-year bonds should be equal to the return on one N-year bond.
The E around future bond prices represents expected valuesExpected ValueExpected value (also known as EV, expectation, average, or mean value) is a long-run average value of random variables. The expected value also indicates since investors don’t know future bond prices.
The Inverted Yield Curve – Bond Market Forecast of Recession
The yield curve is often seen as a bond market measure of confidence in the economy. A positive slope implies the bond marketBond PricingBond pricing is the science of calculating a bond's issue price based on the coupon, par value, yield and term to maturity. Bond pricing allows investors expects the economy to do well, and a negative slope implies the bond market expects the economy to do badly.
A negatively sloped – inverted – yield curve implies that investors expect interest rates to be lower in the future. This, in turn, implies that investment returns generally will be lower in the future. Lower returns lead to a decrease in investments that is associated with economic stagnation and deflation.
Central banks often counter deflationary pressures in the economy by reducing short-term interest rates. Therefore, an expectation of economic slowdown is consistent with a negatively sloped yield curve.
Inverted Yield Curve – Measures of Inversion
The spread between a 10-year bond and a 2-year bond is often used to check for inversion of the yield curve. If the 10-2 spread falls below 0, then the yield curve is negatively sloped on average between 24 months and 120 months (time to maturity).
Related Readings
Thank you for reading this CFI guide to understanding an inverted yield curve. CFI is the official provider of the global Financial Modeling & Valuation Analyst (FMVA)™Become a Certified Financial Modeling & Valuation Analyst (FMVA)®CFI's Financial Modeling and Valuation Analyst (FMVA)® certification will help you gain the confidence you need in your finance career. Enroll today! certification program, designed to help anyone become a world-class financial analyst. To keep advancing your career, the additional CFI resources below will be useful:
- Bullish and BearishBullish and BearishProfessionals in corporate finance regularly refer to markets as being bullish and bearish based on positive or negative price movements. A bear market is typically considered to exist when there has been a price decline of 20% or more from the peak, and a bull market is considered to be a 20% recovery from a market bottom.
- Held to Maturity SecuritiesHeld to Maturity SecuritiesHeld to maturity securities are securities that companies purchase and intend to hold until they mature. They are unlike trading securities or available for sale securities
- RallyRallyA rally refers to a period of continuous increase in the prices of stocks, indexes or bonds. The word rally is typically used as a buzzword by business media outlets such as Bloomberg to describe a period of increasing prices.
- 10 Year US Treasury Note10-Year US Treasury NoteThe 10-year US Treasury Note is a debt obligation that is issued by the US Treasury Department and comes with a maturity of 10 years.
-
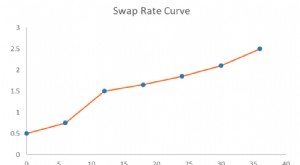
Understanding Swap Rate Curves: A Comprehensive Guide
The swap rate curve is a chart that depicts the relationship between swap rates and all available corresponding maturities. Essentially, it indicates the expected returnsExpected ReturnThe expected re
-
Understanding the Credit Curve: A Guide for Investors
The credit curve is the graphical representation of the relationship between the return offered by a security (credit-generating instrument) and the time to maturity of the security. It measures the i
finance
- Understanding Yield Curve Rollover: A Fixed Income Strategy
- Understanding the Yield Curve: Definition & Significance
- Discount Yield Explained: Calculating Returns on Discounted Bonds
- Understanding Distribution Yield: A Key Metric for REIT & ETF Investors
- Understanding the Flat Yield Curve: Causes & Implications
- Understanding the Par Yield Curve: A Guide for Investors
- Understanding SEC Yield: A Guide for Bond Investors
- Understanding the Economic Implications of an Inverted Treasury Yield Curve
- Understanding the Yield Curve: Market Insights & S&P 500 Update
-
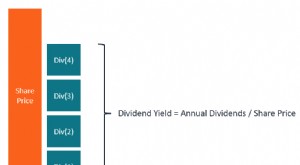 Understanding Forward Dividend Yield: A Key Metric for Investors
Forward dividend yield refers to the projection of a company’s yearly dividend. It’s calculated as a percentage of the current share price. For many investors, the dividends paid out by co...
-
 Shareholder Yield: A Comprehensive Guide to Returns for Investors
Shareholder yield refers to how much money shareholders receive from a company that is in the form of cash dividendsDividendA dividend is a share of profits and retained earnings that a company pays o...