Understanding Yield Curve Rollover: A Fixed Income Strategy
Rolling down the yield curve is when investors sell bondsBondsBonds are fixed-income securities that are issued by corporations and governments to raise capital. The bond issuer borrows capital from the bondholder and makes fixed payments to them at a fixed (or variable) interest rate for a specified period. before their maturity date, in order to get a higher profit. This is a fixed income strategy that investors use in a low interest rate environment. The strategy gets its name from the fact that investors are selling bonds when the yieldYieldYield is defined as an income-only return on investment (it excludes capital gains) calculated by taking dividends, coupons, or net income and dividing them by the value of the investment. Expressed as an annual percentage, the yield tells investors how much income they will earn each year relative to the cost of their investment. is lower.

Summary
- Rolling down the yield curve is a fixed income strategy where investors sell bonds before maturity
- The strategy provides investors with a higher incremental income without increasing exposure to interest rate risk
- Rolling down the yield curve is not a suitable strategy when the yield curve is inverted
How Does the Rolling Down the Yield Curve Strategy Work?
The rolling down the yield curve strategy aims to help investors obtain a high yield while still limiting any loss on the principal. It is achieved by rolling down the yield curve – in other words, selling a bond after holding it for only a few years, and well before its maturity date. The strategy works because the yield and price of bonds move in opposite directions. As the yield decreases, the price increases.
Imagine a 10-year Treasury bondTreasury Bills (T-Bills)Treasury Bills (or T-Bills for short) are a short-term financial instrument issued by the US Treasury with maturity periods from a few days up to 52 weeks. with five years left to maturity. The yield of the bond now is lower compared to the yield five years before. This is because higher yields are given to longer-term bonds due to higher risk. The bond now has a lower yield and lower discount rate.
Due to the nature of bonds, the price of the bond is now higher than it was before. The strategy also limits potential loss on the principal because investors are selling the bond early, so they incur less exposure to credit riskCredit RiskCredit risk is the risk of loss that may occur from the failure of any party to abide by the terms and conditions of any financial contract, principally,.
What are the Benefits of Rolling Down the Yield Curve?
By buying a longer-term bond, investors receive higher yields on their investment. It means higher income from couponsCoupon BondA coupon bond is a type of bond that includes attached coupons and pays periodic (typically annual or semi-annual) interest payments during its lifetime and its par value at maturity. These bonds come with a coupon rate, which refers to the bond's yield at the date of issuance. or when the bond is sold. Another benefit is that rolling down the yield curve provides more options for investors.
For example, if an investor wants to invest their money for five years, they can either buy a five-year bond or buy a longer-term bond and sell it after five years. By buying the longer-term bond, they would benefit from the higher incremental income. Also, they would gain from the sale of the bond while still keeping the investment horizon to five years.
When is the Best Time for this Strategy?
Rolling down the yield curve is most suitable in a low-interest-rate environment, with the rate rising or expected to rise. As the interest rate rises, bonds lose value. It is interest rate riskFixed Income Interest Rate RiskFixed income interest rate risk is the risk of a fixed income asset losing value due to a change in interest rates. Since bonds and interest rates have an inverse relationship, as interest rates rise, the value/price of bonds falls. Interest rate risk can be measured by the full valuation approach or the duration/convexity approach. and it impacts bonds with a longer maturity. If interest rates are expected to increase, then investors will tend to stick with short-term bonds as those are less susceptible to interest rate risk.
However, by doing such a thing, the investors are limiting their return to lower yields. It is when rolling down the yield curve becomes profitable. Investors can buy long-term bonds and benefit from the higher yield. But since they plan to sell before maturity, their interest rate risk is not as high.
When to not Use this Strategy
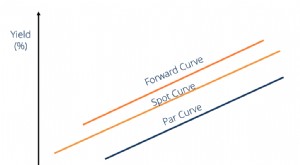
Rolling down the yield curve is not suitable if the yield curve is invertedInverted Yield CurveAn inverted yield curve often indicates the lead-up to a recession or economic slowdown. The yield curve is a graphical representation of the relationship between the interest rate paid by an asset (usually government bonds) and the time to maturity. or if the bond is a premium bond. An inverted yield curve is where the yields of a shorter duration bond are higher than the yield on a longer duration bond. Thus, an investor who wants to invest for only five years has no incentive to purchase a 10-year bond, as they will not receive higher yields.
Another reason to not use the strategy is if the bond is selling at a premium. A premium bond’s value decreases as time goes on. Thus, an investor will not be able to roll down the yield curve and sell the bond for more than they paid for it.
Additional Resources
CFI offers the Commercial Banking & Credit Analyst (CBCA)™Program Page - CBCAGet CFI's CBCA™ certification and become a Commercial Banking & Credit Analyst. Enroll and advance your career with our certification programs and courses. certification program for those looking to take their careers to the next level. To keep learning and advancing your career, the following resources will be helpful:
- Fixed Income Fundamental Course
- Coupon BondCoupon BondA coupon bond is a type of bond that includes attached coupons and pays periodic (typically annual or semi-annual) interest payments during its lifetime and its par value at maturity. These bonds come with a coupon rate, which refers to the bond's yield at the date of issuance.
- Floating Rate NoteFloating Rate NoteA floating rate note (FRN) is a debt instrument whose coupon rate is tied to a benchmark rate such as LIBOR or the US Treasury Bill rate. Thus, the coupon rate on a floating rate note is variable. It is typically composed of a variable benchmark rate + a fixed spread.
- Laffer CurveLaffer CurveThe Laffer Curve is a theoretical explanation of the relationship between the tax rates set by the government and the tax revenue collected at
-
Understanding the Forward Curve: A Comprehensive Guide
The forward curve or the future curve is the graphicalTypes of GraphsTop 10 types of graphs for data presentation you must use - examples, tips, formatting, how to use them for effective communication
-

Short Interest Ratio: Understanding Investor Sentiment & Market Risk
The short interest ratio is a mathematical indicator of the average number of days it takes for short sellers to repurchase borrowed securities in the open marketOpen MarketAn open market is an econom
finance
- Understanding Annual Percentage Yield (APY): A Comprehensive Guide
- Compound Interest Formula: Calculate & Understand Growth
- Understanding Inverted Yield Curves: Recession Indicator?
- Nominal Interest Rate Explained: Definition & Implications
- Swap Rate Explained: Understanding Fixed Exchange Rates in Derivatives
- Understanding the Yield Curve: Definition & Significance
- Yield to Maturity (YTM): Definition & Calculation | [Your Brand/Website Name]
- Understanding the Flat Yield Curve: Causes & Implications
- Understanding the Par Yield Curve: A Guide for Investors
-
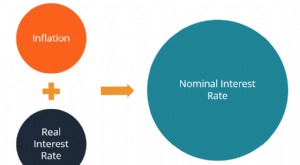 Fisher Equation Explained: Understanding Inflation & Interest Rates
The Fisher equation is a concept in economics that describes the relationship between nominal and real interest rates under the effect of inflationInflationInflation is an economic concept that refers...
-
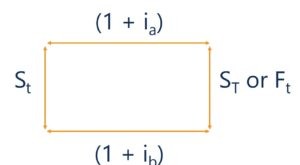 Interest Rate Parity (IRP): Understanding the Relationship
The interest rate parity (IRP) is a theory regarding the relationship between the spot exchange rateSpot PriceThe spot price is the current market price of a security, currency, or commodity avai...