Advance/Decline Ratio (ADR): A Comprehensive Guide
The advance decline ratio (ADR) is a technical indicatorTechnical Analysis - A Beginner's GuideTechnical analysis is a form of investment valuation that analyses past prices to predict future price action. Technical analysts believe that the collective actions of all the participants in the market accurately reflect all relevant information, and therefore, continually assign a fair market value to securities. used to assess stock market sentiment. The ratio compares the number of stocks that increased in value to the number of stocks that decreased in value. In other words, the ADR compares the number of stocks that rose in price versus the number of stocks that declined in price.
Formula for the Advance Decline Ratio
The formula for the advance decline ratio is as follows:

Where:
- Number of Advancing Stocks refers to the number of stocks that increased in value; and
- Number of Declining Stocks refers to the number of stocks that declined in value.
Note: The ratio can be used for any desired timeframe. For example, a traderSix Essential Skills of Master TradersJust about anyone can become a trader, but to be one of the master traders takes more than investment capital and a three-piece suit. Keep in mind: there is a sea of individuals looking to join the ranks of master traders and bring home the kind of money that goes with that title. can use the ADR over a one-day period, a one-month period, or a one-year period.
Example of the Advance Decline Ratio
An investor is looking to determine the market sentiment on a specific date. To do so, the trader gathers the information shown below. Assume that the stocks shown below are representative of the market. What is the advance decline ratio?
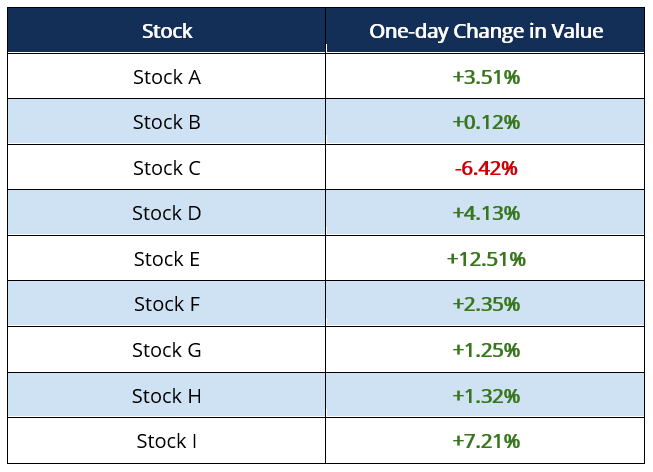
With the nine stocks above, eight stocks increased in value while one stock decreased in value. As such, the advance decline ratio is 8 / 1 = 8.
Interpreting the Advance Decline Ratio
The advance decline ratio can be looked at on a trended basis or by itself.
1. On a trended basis
Looking at the advance decline ratio on a trended basis provides an indication as to whether the market is expected to show a bullish or bearishBullish and BearishProfessionals in corporate finance regularly refer to markets as being bullish and bearish based on positive or negative price movements. A bear market is typically considered to exist when there has been a price decline of 20% or more from the peak, and a bull market is considered to be a 20% recovery from a market bottom. trend. A ratio that is increasing over time signals a bullish market trend while a ratio that is declining over time signals a bearish market trend. For example, consider the ADR over a 10-day period (the ratio is taken once a day):
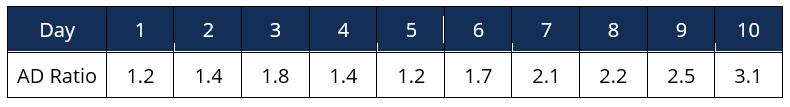
Although the ADR dipped on days four and five, the 10-day trend of the ratio points upwards. As such, to an investor, it may signal bullish momentum.
2. By itself
Looking at the advance decline ratio by itself provides an indication as to whether the market is oversold or overbought. A ratio that is relatively high signals an overbought market while a ratio that is relatively low signals an oversold market. For example, assume the 15-day moving average ADR was 1. The next day, the ADR was 4.3. As such, the ratio is high relative to the 15-day moving average and signals an overbought market.
It is important to keep in mind that it is uncommon for traders to use the ADR as the sole technical indicator when making trading decisions. The ratio should be used in conjunction with other technical indicators and fundamental analysis when forming a trading decision.
ADR in the News
The number of advancing stocks, declining stocks and unchanged stocks for major U.S. indices can be found on The Wall Street Journal.
For example, on August 5, 2019, U.S. President Trump accused China of manipulating its currency by weakening the yuan to make Chinese exports cheaper. On that day, using the information provided by The Wall Street Journal, the ADR for the New York Stock Exchange (NYSE) was 0.1057 (288/2,724).
More Resources
CFI offers the Financial Modeling & Valuation Analyst (FMVA)™Become a Certified Financial Modeling & Valuation Analyst (FMVA)®CFI's Financial Modeling and Valuation Analyst (FMVA)® certification will help you gain the confidence you need in your finance career. Enroll today! certification program for those looking to take their careers to the next level. To keep learning and advancing your career, the following resources will be helpful:
- Head and Shoulders Pattern – Technical AnalysisHead and Shoulders Pattern – Technical AnalysisThe head and shoulders is a pattern commonly seen in trading charts. The head and shoulders pattern is a predicting chart formation that usually indicates a reversal in trend where the market makes a shift from bullish to bearish, or vice-versa.
- Primary MarketPrimary MarketThe primary market is the financial market where new securities are issued and become available for trading by individuals and institutions. The trading activities of the capital markets are separated into the primary market and secondary market.
- Investing: A Beginner’s GuideInvesting: A Beginner's GuideCFI's Investing for Beginners guide will teach you the basics of investing and how to get started. Learn about different strategies and techniques for trading
- Trade Order TimingTrade Order Timing - TradingTrade order timing refers to the shelf-life of a specific trade order. The most common types of trade order timing are market orders, GTC orders,
-

Short Interest Ratio: Understanding Investor Sentiment & Market Risk
The short interest ratio is a mathematical indicator of the average number of days it takes for short sellers to repurchase borrowed securities in the open marketOpen MarketAn open market is an econom
-
Sortino Ratio: A Comprehensive Guide to Downside Risk
The Sortino ratio is a risk-adjustment metric used to determine the additional return for each unit of downside risk. It is computed by first finding the difference between an investment’s avera
invest
- Current Ratio: Definition, Calculation & Financial Health
- Operating Ratio: Definition, Calculation & Importance
- Quick Ratio: Understanding Your Business's Short-Term Liquidity
- Reserve Ratio Explained: Understanding Bank Reserves
- Understanding the Retention Ratio: Reinvesting for Growth
- Sharpe Ratio: Calculate & Interpret Investment Performance
- Understanding the Call Market: Trading Hours & Price Determination
- Understanding the Money Market: Short-Term Debt & Lending
- NASDAQ Explained: A Comprehensive Guide to the Stock Market Exchange
-
 Put-Call Ratio (PCR): Understanding Market Sentiment & Options Trading
The put-call ratio (PCR) is an indicator used by investors to gauge the outlook of the market. The ratio uses the volume of puts and calls over a determined time period on a market index to determine ...
-
 Understanding the S&P 500: A Comprehensive Guide
The Standard and Poor’s 500 Index, abbreviated as S&P 500 index, is an index comprising the stocks of 500 publicly traded companies in the U.S. with the highest values of market capitalizati...