Sortino Ratio: A Comprehensive Guide to Downside Risk
The Sortino ratio is a risk-adjustment metric used to determine the additional return for each unit of downside risk. It is computed by first finding the difference between an investment’s average return rate and the risk-free rateRisk-Free RateThe risk-free rate of return is the interest rate an investor can expect to earn on an investment that carries zero risk. In practice, the risk-free rate is commonly considered to equal to the interest paid on a 3-month government Treasury bill, generally the safest investment an investor can make.. The result is then divided by the standard deviation of negative returns. Ideally, a high Sortino ratio is preferred, as it indicates that an investor will earn a higher return for each unit of a downside risk.
Summary
- The Sortino ratio is used to determine the risk-adjusted return on investment.
- It is a refinement of the Sharpe ratio but only penalizes the returns, which have downside risks.
- To measure the Sortino ratio, start by finding the difference between the weighted mean of return and the risk-free return rate. Next, find the quotient between this difference and the standard deviation of downside risks.
Understanding the Sortino Ratio
If you’re looking to invest, you should not concentrate on only the rate of returnRate of ReturnThe Rate of Return (ROR) is the gain or loss of an investment over a period of time copmared to the initial cost of the investment expressed as a percentage. This guide teaches the most common formulas. It would be better if you also considered the associated level of risk. Risk refers to the likelihood that an asset’s or security’s financial performance will differ from what is expected.
A downside risk is a potential loss from your investment. Conversely, a potential financial gain is known as an upside risk.
Unfortunately, many performance metrics fail to account for the variation in the risk of an investment. They merely calculate their rates of return. But not so with the Sortino ratio. The indicator examines changes in the risk-free rate; hence, enabling investors to make more informed decisions.
The Sortino ratio is an improvement of the Sharpe ratioSharpe RatioThe Sharpe Ratio is a measure of risk-adjusted return, which compares an investment's excess return to its standard deviation of returns. The Sharpe Ratio is commonly used to gauge the performance of an investment by adjusting for its risk., another metric that helps individuals gauge the performance of an investment when it has been adjusted for risk. What sets the Sortino ratio apart is that it acknowledges the difference between upside and downward risks. More specifically, it provides an accurate rate of return, given the likelihood of downside risk, while the Sharpe ratio treats both upside and downside risks equally.
How to Calculate the Sortino Ratio
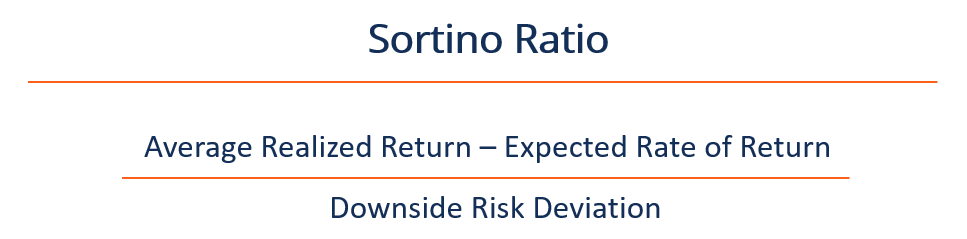
The formula for calculating the Sortino ratio is:
Sortino Ratio = (Average Realized Return – Expected Rate of Return) / Downside Risk Deviation
The average realized return refers to the weighted mean return of all the investments in an individual’s portfolio. On the other hand, the expected rate of return (required return rate), or risk-free rate, is the return on long-term government securities.
For our example, we will use:
S = (R – T) / DR
Where:
- S – Sortino ratio
- R – Average realized return
- T – Required rate of return
- DR – Target downside deviation
Assume we’re given the following annual return rates: 4%, 10%, 15%, 20%, -5%, -2%, -6%, 8%, 23%, and 13%.
1. The annual average return rate is 8% = (4% + 10% + 15% + 20% + -5% + -2% + -6% + 8% + 23% + 13%) / 10
2. Let’s say the target or required rate of return is 7%. The additional return will then be 1% (8% – 7%). The value will make up the numerator in our equation.
3. Next, find the standard deviation of downward risks (those with a negative value). We will not consider those with positive returns as their deviations are zero.
Thus, square the downside deviations, then find their average as follows:
(-5%)² = 0.0025
(-2%)² = 0.0004
(-6%)² = 0.0036
Average = (0.0025 + 0.0004 + 0.0036) / 10 = 0.00065
5. For the final outcome, find the standard deviation by getting the square root of the result:
√0.00065 = 0.0255
It gives us:
R = 8%
T = 7%
DR = 0.0255
6. Finally, compute the Sortino ratio as shown:
S = (R – T) / DR
R – T = 1% or 0.01
S = 0.01 / 0.0255 = 0.392
As a rule of thumb, a Sortino ratio of 2 and above is considered ideal. Thus, this investment’s 0.392 rate is unacceptable.
When to Use the Sortino Ratio
Compared to the Sharpe ratio, the Sortino ratio is a superior metric, as it only accounts for the downside variability of risks. Such an analysis makes sense, as it enables investors to assess downside risks, which is what they should worry about. Upward risks (i.e., when an investment generates an unexpected financial gain) isn’t really a cause for concern.
By comparison, the Sharpe ratio treats upside and downside risks in the same way. It means that even those investments that produce gains are penalized, which should not be the case.
Therefore, the Sortino ratio should be used to assess the performance of high volatility assets, such as shares. In comparison, the Sharpe ratio is more suitable for analyzing low volatility assets, such as bonds.
Key Considerations
While the Sortino ratio is an excellent metric for comparing investments, there are a couple of things you should take into account. One is the timeframe. It would help if you considered investments made over several years or at least those made during a complete business cycleBusiness CycleA business cycle is a cycle of fluctuations in the Gross Domestic Product (GDP) around its long-term natural growth rate. It explains the.
Doing so allows you to account for both positive and negative stock returns. If you were to record only the positive stock returns, it would not be a true reflection of an investment.
The second factor entails the liquidity of the assets. A portfolio can be construed to show that it is less risky, but it may be because the underlying assets being held are illiquid.
For example, the prices of investments held in privately-owned companies rarely change; hence they are illiquid. If they are incorporated in the Sortino ratio, it will seem as if the risk-adjusted returns are favorable, yet they aren’t.
Wrap Up
The Sortino ratio is almost identical to the Sharpe ratio, but it differs in one way. The Sharpe ratio accounts for risk-adjustments in investments with both positive and negative returns.
In contrast, the Sortino ratio examines risk-adjusted returns, but it only considers the downside risks. In such a way, the Sortino ratio is seen as a better indicator of risk-adjusted returns since it doesn’t consider upside risks, which aren’t a cause for concern to investors.
Related Readings
CFI is the official provider of the global Commercial Banking & Credit Analyst (CBCA)™Program Page - CBCAGet CFI's CBCA™ certification and become a Commercial Banking & Credit Analyst. Enroll and advance your career with our certification programs and courses. certification program, designed to help anyone become a world-class financial analyst. To keep advancing your career, the additional resources below will be useful:
- Downside RiskDownside RiskDownside risk refers to the probability that an asset or security will fall in price. It is the potential loss that could result from a fall
- Effective YieldEffective YieldEffective yield is a financial metric that measures the interest rate – also known as the coupon rate – return on a bond.
- Risk-Adjusted Return RatiosRisk-Adjusted Return RatiosThere are a number of risk-adjusted return ratios that help investors assess existing or potential investments. The ratios can be more helpful
- Treasury Bills (T-Bills)Treasury Bills (T-Bills)Treasury Bills (or T-Bills for short) are a short-term financial instrument issued by the US Treasury with maturity periods from a few days up to 52 weeks.
-

Debt-to-Assets Ratio: Definition, Calculation & Risk Assessment
The Debt to Assets Ratio is a leverage ratioLeverage RatiosA leverage ratio indicates the level of debt incurred by a business entity against several other accounts in its balance sheet, income statem
-
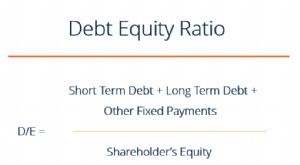
Debt-to-Equity Ratio: Definition, Calculation & Importance
The Debt to Equity ratio (also called the “debt-equity ratio”, “risk ratio”, or “gearing”), is a leverage ratioLeverage RatiosA leverage ratio indicates the le
invest
- Sortino Ratio: Calculation & Interpretation for Investment Risk
- Current Ratio: Definition, Calculation & Financial Health
- Operating Ratio: Definition, Calculation & Importance
- Quick Ratio: Understanding Your Business's Short-Term Liquidity
- Reserve Ratio Explained: Understanding Bank Reserves
- Understanding the Retention Ratio: Reinvesting for Growth
- Sharpe Ratio: Calculate & Interpret Investment Performance
- Understanding Portfolio Active Return: Definition & Calculation
- K-Ratio Explained: Measuring Investment Growth & Consistency
-
 Advertising to Sales Ratio: Measuring Ad Effectiveness & ROI
The advertising to sales ratio, also called the “A to S” for short, measures the effectiveness, or how successful, a company’s advertising strategiesAIDA ModelThe AIDA model, which s...
-
 Understanding the CAPE Ratio: A Guide to Cyclically Adjusted P/E
The CAPE Ratio (also known as the Shiller P/E or PE 10 Ratio) is an acronym for the Cyclically-Adjusted Price-to-Earnings Ratio. The ratio is calculated by dividing a company’s stock price by th...