Sharpe Ratio: Calculate & Interpret Investment Performance
Named after American economist, William Sharpe, the Sharpe Ratio (or Sharpe Index or Modified Sharpe Ratio) is commonly used to gauge the performance of an investment by adjusting for its risk.
The higher the ratio, the greater the investment return relative to the amount of risk taken, and thus, the better the investment. The ratio can be used to evaluate a single stock or investment, or an entire portfolio.
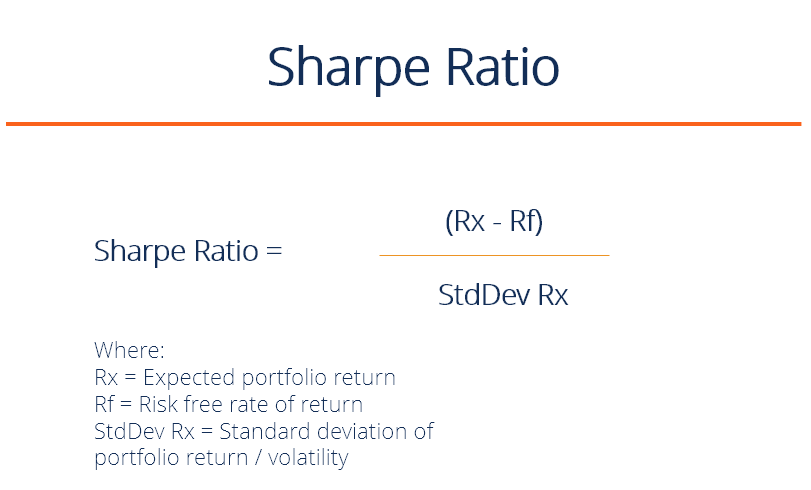
Sharpe Ratio Formula
Sharpe Ratio = (Rx – Rf) / StdDev Rx
Where:
- Rx = Expected portfolio return
- Rf = Risk-free rate of return
- StdDev Rx = Standard deviation of portfolio return (or, volatility)
Sharpe Ratio Grading Thresholds:
- Less than 1: Bad
- 1 – 1.99: Adequate/good
- 2 – 2.99: Very good
- Greater than 3: Excellent
What Does It Really Mean?
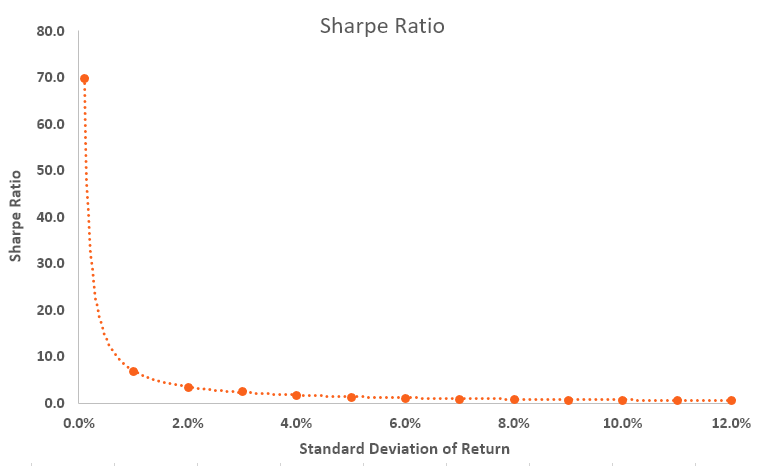
It’s all about maximizing returns and reducing volatility. If an investment had an annual return of only 10% but had zero volatility, it would have an infinite (or undefined) Sharpe Ratio.
Of course, it’s impossible to have zero volatility, even with a government bond (prices go up and down). As volatility increases, the expected return has to go up significantly to compensate for that additional risk.
The Sharpe ratio reveals the average investment return, minus the risk-free rate of return, divided by the standard deviation of returns for the investment. Below is a summary of the exponential relationship between the volatility of returns and the Sharpe Ratio.
Download the Free Template
Enter your name and email in the form below and download the free template now!
Application of the Sharpe Index
An investment portfolio can consist of shares, bonds, ETFs, deposits, precious metals, or other securities. Each security has its own underlying risk-return level that influences the ratio.
For example, assume that a hedge fund manager has a portfolio of stocks with a ratio of 1.70. The fund manager decides to add some commodities to diversify and modify the composition to 80/20, stocks/commodities, which pushes the Sharpe ratio up to 1.90.
While the portfolio adjustment might increase the overall level of risk, it pushes the ratio up, thus indicating a more favorable risk/reward situation. If the portfolio change causes the ratio to go down, then the portfolio addition, while potentially offering attractive returns, would be evaluated by many financial analysts as carrying an unacceptable level of risk, and the portfolio change would not be made.
Example of the Sharpe Index
Consider two fund managers, A and B. Manager A has a portfolio return of 20% while B has a return of 30%. S&P 500 performance is 10%. Although it looks like B performs better in terms of return, when we look at the Sharpe Ratio, it turns out that A has a ratio of 2 while B’s ratio is only 0.5.
The numbers mean that B is taking on substantially more risk than A, which may explain his higher returns, but which also means he has a higher chance of eventually sustaining losses.
Geometric Sharpe Ratio vs. Modified Sharpe Ratio
Geometric Sharpe Ratio is the geometric mean of compounded excess returns divided by the standard deviation of those compoundedCompound Growth RateThe compound growth rate is a measure used specifically in business and investing contexts, that indicates the growth rate over multiple time periods. It is a measure of the constant growth of a data series. The biggest advantage of the compound growth rate is that the metric takes into consideration the compounding effect. returns.
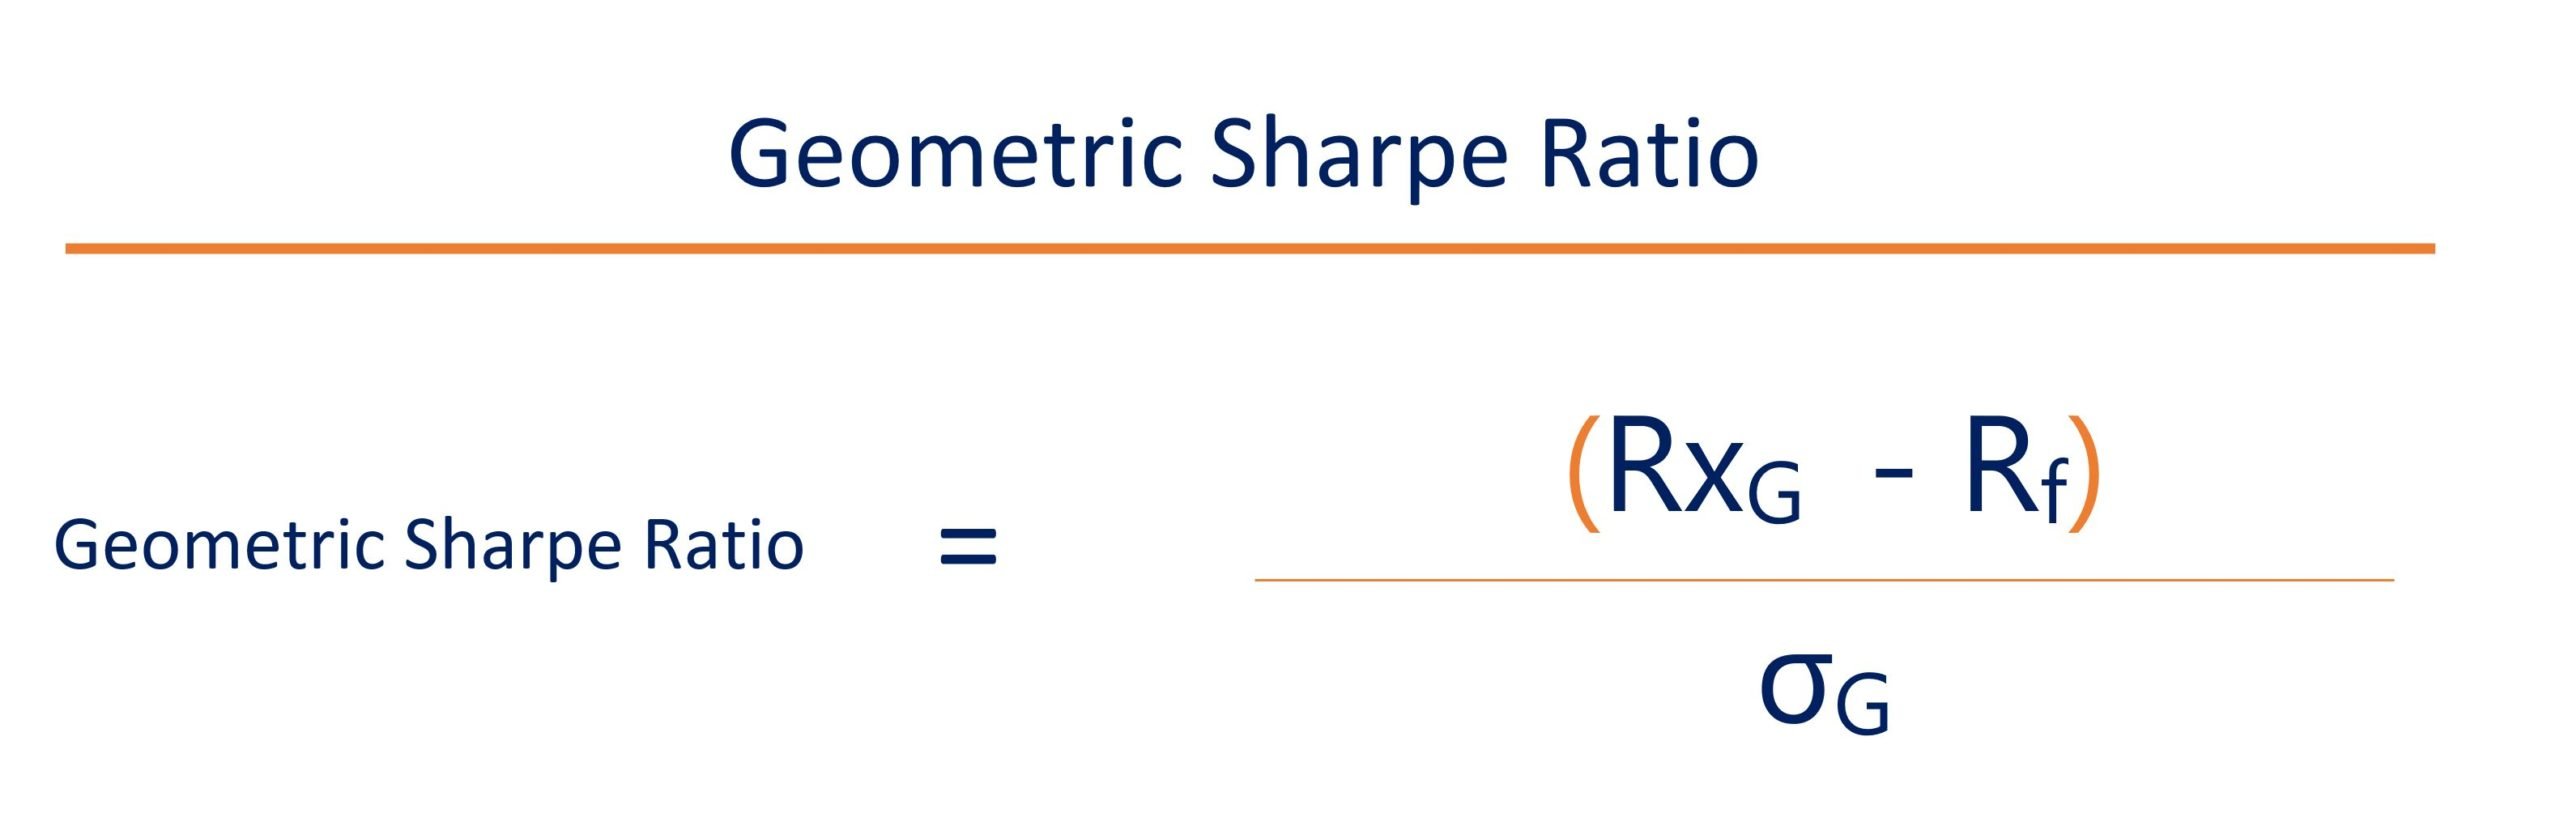
Where:
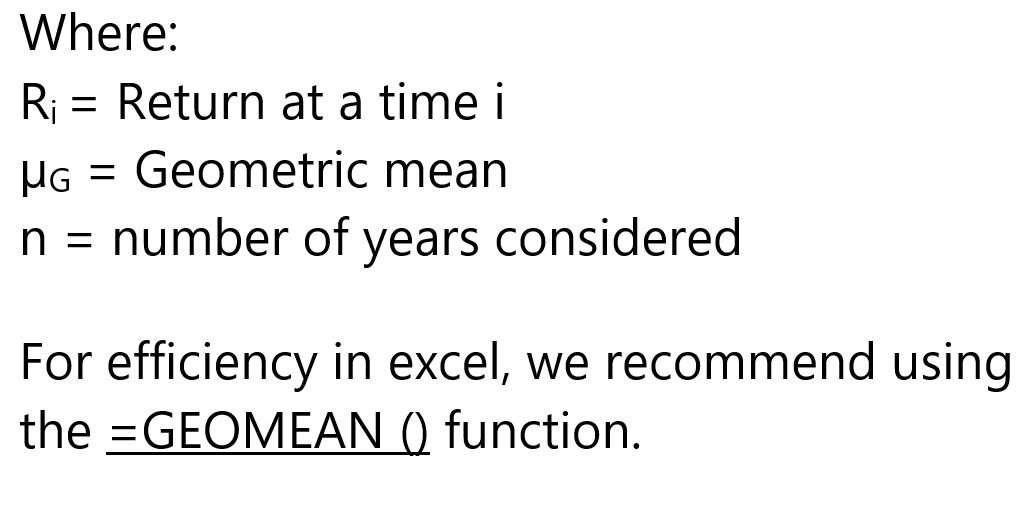
- RxG = Geometric mean of compounded returns
- Rf = Risk-free rate of return
- σG = Standard deviation of compounded returns
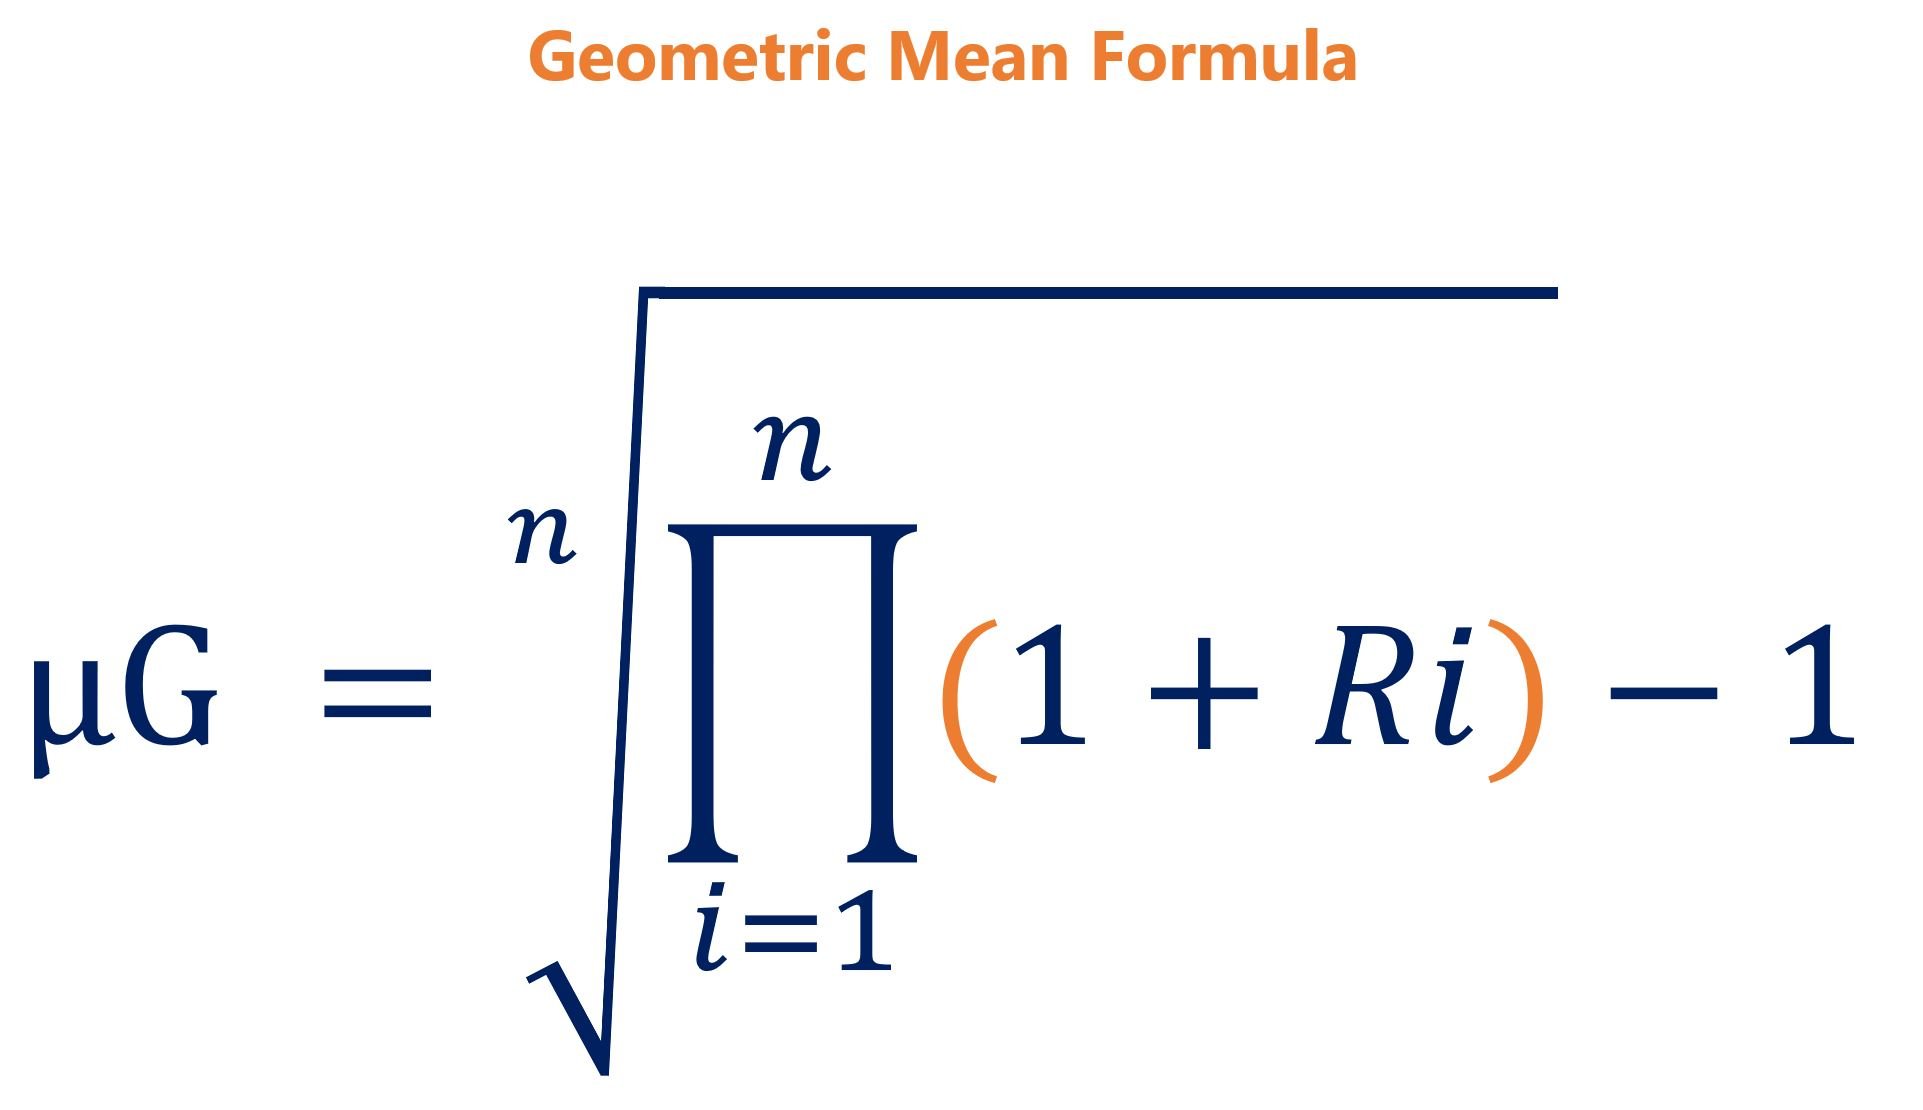
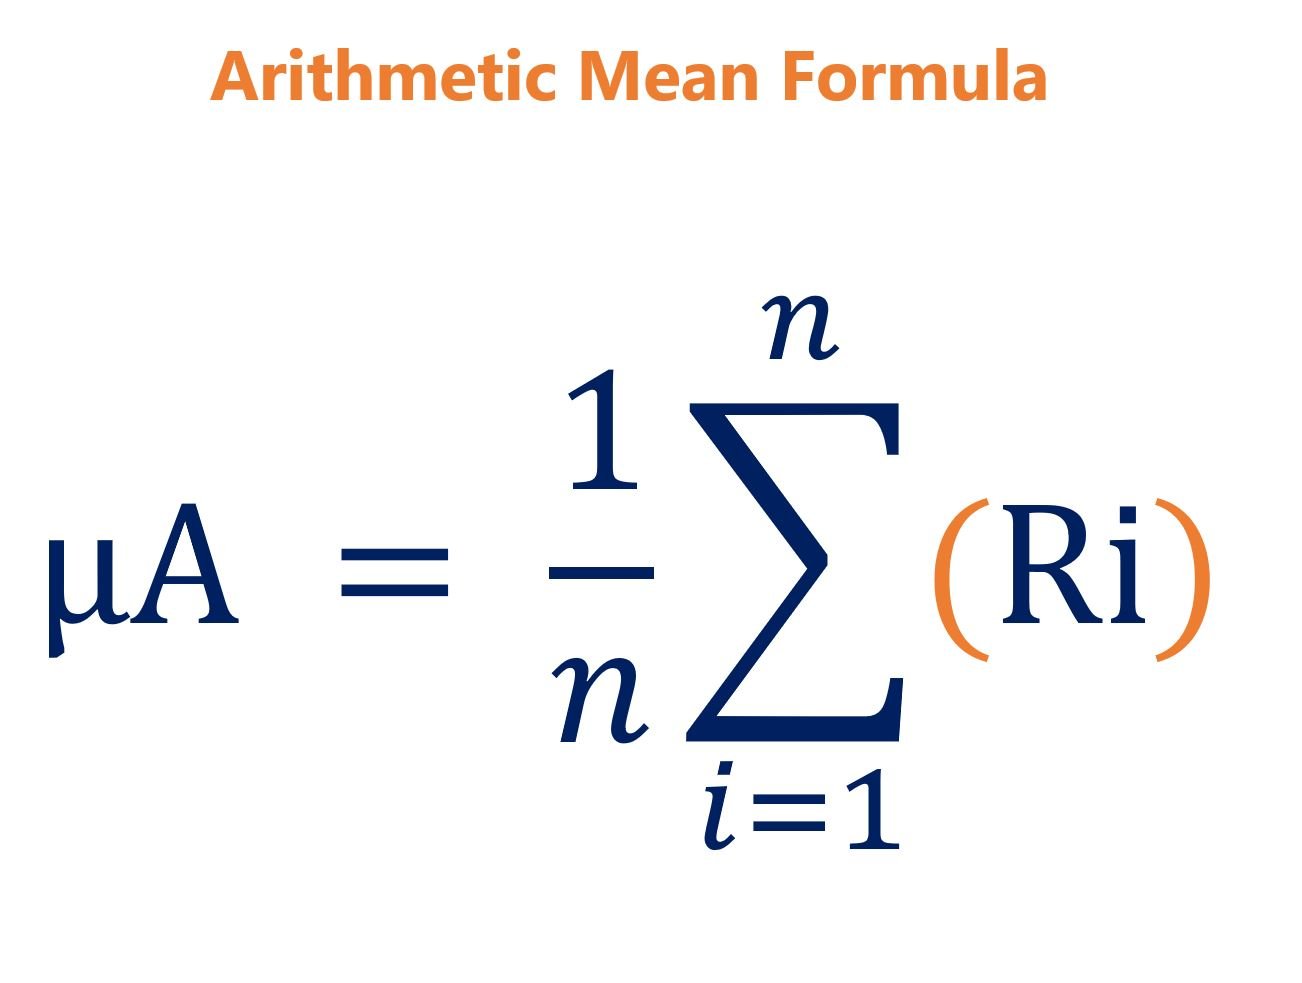
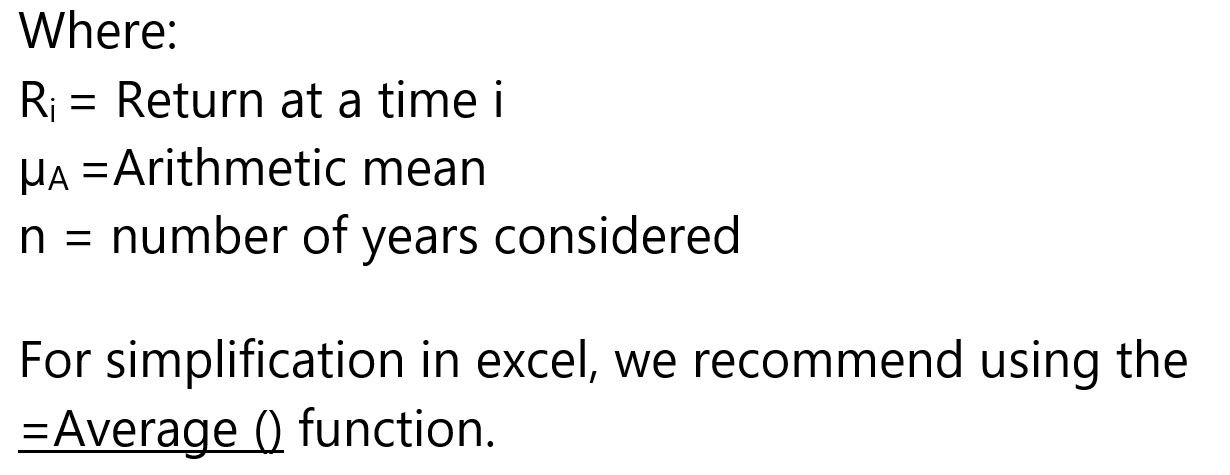
Since the Sharpe index already factors risk in the denominator, using geometric meanGeometric Mean TemplateThis geometric mean template helps you compare investment options by calculating the final value of investments using geometric mean. The geometric mean is the average growth of an investment computed by multiplying n variables and then taking the n square root. In other words, it is the average return of an investment would double count risk. With volatility, the geometric mean will always be lower than its arithmetic mean.
On top of that, the Geometric Sharpe Ratio takes actual returns into account and is a more conservative ratio. Therefore, the main difference between the Modified Sharpe Ratio and Geometric Sharpe Ratio would be the average of the excess returns calculated using the formulas below:
Note: For an apple to apple comparison of returns, the Geometric Sharpe Ratio of a portfolio should always be compared with the Geometric Sharpe Ratio of other portfolios.
Additional Resources
Thanks for reading this article on measuring risk-adjusted return. CFI’s mission is to help you advance your career in corporate finance. To continue learning and advancing your career, we recommend these additional CFI resources:
- Accounting Rate of Return (ARR)ARR - Accounting Rate of ReturnAccounting Rate of Return (ARR) is the average net income an asset is expected to generate divided by its average capital cost, expressed as
- Risk and ReturnRisk and ReturnIn investing, risk and return are highly correlated. Increased potential returns on investment usually go hand-in-hand with increased risk. Different types of risks include project-specific risk, industry-specific risk, competitive risk, international risk, and market risk.
- Internal Rate of Return (IRR)Internal Rate of Return (IRR)The Internal Rate of Return (IRR) is the discount rate that makes the net present value (NPV) of a project zero. In other words, it is the expected compound annual rate of return that will be earned on a project or investment.
- Financial Modeling GuideFree Financial Modeling GuideThis financial modeling guide covers Excel tips and best practices on assumptions, drivers, forecasting, linking the three statements, DCF analysis, more
-

Calmar Ratio: Measuring Risk-Adjusted Investment Performance
The Calmar ratio is a formula that measures the performance of an investment fund – such as a hedge fundHedge FundA hedge fund, an alternative investment vehicle, is a partnership where investor
-

Portfolio Turnover Ratio: Definition, Calculation & Significance
The portfolio turnover ratio is the rate of which assets in a fund are bought and sold by the portfolio managers. In other words, the portfolio turnover ratio refers to the percentage change of the as
finance
- Acid-Test Ratio: Understanding Your Company's Short-Term Liquidity
- Advertising to Sales Ratio: Measuring Ad Effectiveness & ROI
- Understanding the CAPE Ratio: A Guide to Cyclically Adjusted P/E
- Current Ratio: Definition, Calculation & Financial Health
- Debt-to-Assets Ratio: Definition, Calculation & Risk Assessment
- Operating Ratio: Definition, Calculation & Importance
- Quick Ratio: Understanding Your Business's Short-Term Liquidity
- Reserve Ratio Explained: Understanding Bank Reserves
- Understanding the Retention Ratio: Reinvesting for Growth
-
![Shareholder Equity Ratio: Definition & Calculation | [Your Company Name]](https://www.etffin.com/article/uploadfiles/202110/2021100815180064_S.png) Shareholder Equity Ratio: Definition & Calculation | [Your Company Name]
Shareholder Equity Ratio: Definition & Calculation | [Your Company Name]The shareholder equity ratio is a ratio that shows the amount of a company’s assets that have been financed using the owner’s equity instead of debt. It shows the portion of shareholders&r...
-
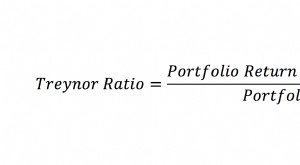 Treynor Ratio: Understanding Risk-Adjusted Portfolio Performance
The Treynor Ratio is a portfolio performance measure that adjusts for systematic riskSystematic RiskSystematic risk is that part of the total risk that is caused by factors beyond the control of a spe...