Dispersion Explained: Understanding Data Spread and Investment Risk
Dispersion is a term that describes the spread of values against a specific variable. Dispersion can be measured through:
- Range
- Variance
- Standard deviationStandard DeviationFrom a statistics standpoint, the standard deviation of a data set is a measure of the magnitude of deviations between values of the observations contained

Within the realm of finance, dispersion is used to determine the potential returns on an investment, as well as the inherent risk of a portfolio of investments. Thus, it is a tool used to measure uncertainty.
Summary
- Dispersion is the range of potential returns an investment yields based on their risk, which can be calculated using historical returns or the historical volatility based on those returns.
- Dispersion uses statistical ratios and measures such as alpha and beta, which, respectively, determines whether the investment outperforms the market, as well as its riskiness relative to a market index.
- The higher the positive alpha, the more the investment outperforms the market, while a negative alpha illustrates underperformance.
- Beta can range between 1, >1, or <1, where 1 implies the same risk as the market index, >1 equates to more risk than the market, and <1 indicates less riskiness than the market.
Understanding Dispersion
Upon the countless securities to invest in, many factors are evaluated and considered. One example is the inherent risk that an investment yields. Dispersion can measure that risk and provide investors with a clearer perspective on which investments may appear to be appealing.
The dispersion of an asset’s return will show the volatilityVolatilityVolatility is a measure of the rate of fluctuations in the price of a security over time. It indicates the level of risk associated with the price changes of a security. Investors and traders calculate the volatility of a security to assess past variations in the prices and risk of adding that asset within an individual’s portfolio. The greater the range of returns on the asset, the riskier and more volatile it is as a whole.
For example, if an asset yields a historical return that can range from +15% to -20%, that would be much more volatile relative to a different asset that may yield a smaller range of historical returns, such as +5% to -5%.
Alpha
Alpha is a measure used by portfolio managers to determine whether the investment or portfolio’s risk-adjusted returns are outpacing the market. It evaluates the performance of an investment against a market index by comparing the excess return of the investment to the benchmark index’s returns. A positive alpha indicates that the trading strategy or portfolio is indeed outperforming the market, while a negative alpha implies otherwise.
Beta
The primary and most renowned statistical measure for risk is beta, which measures the volatility of an asset’s returns relative to the entire market or index.
Beta can be the following:
- 1
- Greater than 1
- Less than 1
A beta of 1 indicates that the asset’s returns and volatility are in unison with the market. However, a beta greater than 1 indicates that the asset would likely outperform the market but is also more volatile. For example, if the market is up 10%, but the beta of the asset is 1.5, the asset may be up by 15%.
On the other hand, it is important to be aware that if the market goes down, the asset with the beta that is greater than 1 will likely yield even lower returns than the market. Thus, beta amplifies returns.
A beta that is less than 1 implies that the asset is less risky than the market. It also indicates that the asset trails the market rather than outperforming it. For example, if the beta is 0.5 and the market is up 10%, the asset would likely provide a 5% return.
CAPM Formula
The capital asset pricing model (CAPM) identifies the required return of an investment and is an equation that integrates both beta and alpha. As the CAPM formula assumes that the portfolio being evaluated is already diversified, it focuses solely on systematic (market) riskSystematic RiskSystematic risk is that part of the total risk that is caused by factors beyond the control of a specific company or individual. Systematic risk is caused by factors that are external to the organization. All investments or securities are subject to systematic risk and therefore, it is a non-diversifiable risk. to determine expected portfolio returns. The original equation is defined as follows:

Where:
Rp = Realized return
Rf = Risk-free rateRisk-Free RateThe risk-free rate of return is the interest rate an investor can expect to earn on an investment that carries zero risk. In practice, the risk-free rate is commonly considered to equal to the interest paid on a 3-month government Treasury bill, generally the safest investment an investor can make.
Rm = Market return
The rearranged formula to calculate alpha is as follows:
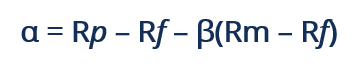
In such a case, alpha is determined by the difference between the realized return of the portfolio and the expected market return of the portfolio (required return).
Additional Resources
CFI offers the Capital Markets & Securities Analyst (CMSA)®Program Page - CMSAEnroll in CFI's CMSA® program and become a certified Capital Markets &Securities Analyst. Advance your career with our certification programs and courses. certification program for those looking to take their careers to the next level. To keep learning and advancing your career, the following resources will be helpful:
- DivergenceDivergenceDivergence is when the asset price moves in the direction opposite to what a technical indicator indicates. When a stock is diverging, it
- Expected ReturnExpected ReturnThe expected return on an investment is the expected value of the probability distribution of possible returns it can provide to investors. The return on the investment is an unknown variable that has different values associated with different probabilities.
- Return on Investment (ROI)Return on Investment (ROI)Return on Investment (ROI) is a performance measure used to evaluate the returns of an investment or compare efficiency of different investments.
- Negative ReturnNegative ReturnA negative return represents an economic loss incurred by an investment in a project, a business, a stock, or other financial instruments.
-
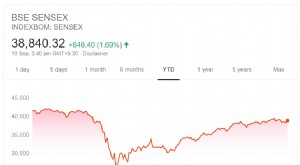
Sensex Explained: Understanding India's Key Stock Market Index
Sensex, also known as the S&P BSE Sensex Index, is the benchmark index that tracks India’s Bombay Stock Exchange (BSE). The Sensex is composed of the 30 largest and most-traded stocks within
-

Understanding Algorithmic Trading Spoofing: Definition & Impact
Spoofing is a disruptive algorithmic trading practice that involves placing bids to buy or offers to sell futures contractsFutures ContractA futures contract is an agreement to buy or sell an underlyi
invest
- Understanding Auction Markets: How Prices Are Determined
- Doji Candlestick Pattern: Meaning & Trading Signals
- Dynamic Asset Allocation: A Comprehensive Guide
- Understanding Frothy Markets: Risks & Opportunities
- Understanding Inefficient Markets: Causes & Implications
- Understanding Market Cycles: Trends & Economic Environments
- Understanding Market Depth: A Guide for Traders
- Understanding Market Exposure: Risk & Portfolio Allocation
- Understanding Market Indexes: A Comprehensive Guide
-
 Understanding Stock Rallies: Definition & What Causes Them
A rally refers to a period of continuous increase in the prices of stocks, indexes or bondsBondsBonds are fixed-income securities that are issued by corporations and governments to raise capital. The ...
-
 Understanding Secular Markets: Long-Term Trends & Investment Strategies
A secular market is predominantly driven and impacted by elements or forces that are likely to be present in the foreseeable future. The forces can impact the price or value of a financial assetFinanc...