Pivot Points: A Day Trader's Guide to Support & Resistance
Pivot points refer to technical indicators used by day tradersDay TradingThe main attribute of day trading is that the purchasing and selling of securities occurs within the same trading day. to identify potential support and resistance price levels in a securities market. They are based on the previous day’s high, low, and closing prices. Traders use pivot points and the support and resistance levels they provide to determine potential entry, exit, and stop-loss prices for trades.
CFI’s Financial Modeling and Valuation Analyst (FMVA)™Become a Certified Financial Modeling & Valuation Analyst (FMVA)®CFI's Financial Modeling and Valuation Analyst (FMVA)® certification will help you gain the confidence you need in your finance career. Enroll today! certification program can provide you with a toolset that you can use to become a world-class financial analyst!

Originally, pivot points were developed by floor traders who worked in a fast-moving environment in the equity and commodities marketsTypes of Markets - Dealers, Brokers, ExchangesMarkets include brokers, dealers, and exchange markets. Each market operates under different trading mechanisms, which affect liquidity and control. The different types of markets allow for different trading characteristics, outlined in this guide. At the start of each trading day, they would use the previous day’s high, low, and close prices to calculate the pivot for the current trading day.
The pivot point is then used to identify two support and two resistance levels for the day. The support and resistance levels are determined based on the difference between the previous day’s high and low prices and the pivot point.
Calculation Techniques
The main technique that most traders use to calculate pivot points is the five-point system. The system uses the previous day’s high, low, and close prices, as well the support and resistance levels. The five-point system uses the following equations:
Pivot point (P) = (Previous High + Previous Low + Previous Close)/3
S1= (P x 2) – Previous high
S2 = P – (Previous High – Previous Low)
R1 = (P x 2) – Previous Low
R2 = P + (Previous High – Previous Low)
Where:
- S1= Support 1
- S2 = Support 2
- R1 = Resistance 1
- R2 = Resistance 2
Day Trading with Pivot Points
When calculating pivot points, the point acts as the primary support or resistance level. High volume trading often occurs when price is at or near the pivot point. The following are the main trading strategies used with pivot points:
1. Pivot point bounces
If the price action hesitates and bounces back before reaching the pivot level, you should enter the trade in the direction of the bounce. If you are testing the trade with price above the pivot line, and the price moves close to the pivot line and bounces back to the upside, you should enter a long (buy) trade.
On the other hand, if you are testing a pivot line from the lower side and the price bounces back to the downside after hitting the pivot, you should sell short. The stop-loss for the trade is located above the pivot line if the trade is short, and below the pivot line if the trade is long.
2. Pivot point breakout
When the price action breaks through the pivot line – such as crossing from below it to above it – the trade should continue in the direction of the breakout. If the breakout is bearish, the trade should be short, while for a bullish breakout, the trade should be long. A good place to implement a stop-loss orderStop-Loss OrderA stop-loss order is a tool used by traders and investors to limit losses and reduce risk exposure. Learn more about stop-loss orders in this article. is slightly to the other side of the pivot line. For example, if buying long based on price crossing above the pivot line, a sell-stop would be placed a bit below the pivot line.
CFI’s Financial Modeling and Valuation Analyst (FMVA)™Become a Certified Financial Modeling & Valuation Analyst (FMVA)®CFI's Financial Modeling and Valuation Analyst (FMVA)® certification will help you gain the confidence you need in your finance career. Enroll today! certification program teaches you skills that you can use to evaluate a company’s value on the market!
Why Day Traders Prefer Pivot Points
Day traders often prefer using pivot analysis over other technical indicators for several reasons. They include:
1. High accuracy
The pivot point is considered one of the most accurate indicators in the market. This explains why a majority of day traders like using it to determine trade entry or exit points. It enables traders entering the market to follow the overall flow of the market since it uses the previous day’s trading action to predict the current day’s likely action.
2. Short time frames
Unlike other trading tools that use long time frames, the pivot point indicator obtains data from a single day of trading. It takes the previous day’s high, low and close prices to predict probable support and resistance levels. Although pivot trading is primarily applied on the daily time frame, pivots can also be calculated for much shorter time frames, such as the hourly or 15-minute charts.
3. Easy to use
The pivot point indicator is an easy to use tool that’s been incorporated in most trading platforms. The platforms automatically calculate support and resistance levels, so the trader doesn’t have to do it manually. After getting the pivot levels, the trader can concentrate on figuring out their approach to the market for the day.
Uses of Pivot Points
1. Determine market trends
Traders can use pivot points to determine market trends depending on the direction of the price action. When the price action remains or drops below the pivot level, it shows a bearish marketBullish and BearishProfessionals in corporate finance regularly refer to markets as being bullish and bearish based on positive or negative price movements. A bear market is typically considered to exist when there has been a price decline of 20% or more from the peak, and a bull market is considered to be a 20% recovery from a market bottom.. On the other hand, when the price action remains or crosses above the pivot, it shows that the market is bullish.
2. Enter and exit the market
Traders can also use the pivot point system to make a decision on when to enter and exit the market. For example, a trader can set a stop-loss near any of the identified support or resistance levels.
Related Readings
Thank you for reading CFI’s explanation of Pivot Points. CFI is the official provider of the Financial Modeling and Valuation Analyst (FMVA)™Become a Certified Financial Modeling & Valuation Analyst (FMVA)®CFI's Financial Modeling and Valuation Analyst (FMVA)® certification will help you gain the confidence you need in your finance career. Enroll today! certification program, designed to transform anyone into a world-class financial analyst.
To keep learning and developing your knowledge of financial analysis, we highly recommend the additional resources below:
- Aroon IndicatorAroon Indicator - Technical AnalysisThe aroon indicator uses the aroon-up and aroon-down calculations to identify the beginning of a new trend, or a changing trend in the market.
- Golden CrossGolden CrossA Golden Cross is a basic technical indicator that occurs in the market when a short-term moving average (50-day) of an asset rises above a long-term moving average (200-day). When traders see a Golden Cross occur, they view this chart pattern as indicative of a bull market.
- Momentum InvestingMomentum InvestingMomentum investing is an investment strategy aimed at purchasing securities that have been showing an upward price trend or short-selling securities that
- Triangle Patterns – Technical AnalysisTriangle Patterns - Technical AnalysisThe triangle patterns are common chart patterns every trader should know. Triangle patterns are important because they help indicate the continuation of a bullish or bearish market. They can also assist a trader in spotting a market reversal.
-

Investment-Grade Bonds: Understanding Credit Risk & Ratings
An investment-grade bond is a bond classification used to denote bonds that carry a relatively low credit riskCredit RiskCredit risk is the risk of loss that may occur from the failure of any party to
-
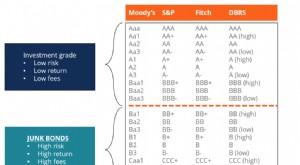
Understanding Junk Bonds: Risks, Rewards, and Investment Strategies
Junk bonds, also known as high-yield bonds, are bonds that are rated below investment grade by the big three rating agencies (see image below). Junk bonds carry a higher risk of defaultMarket Ri
invest
- Basis Points (BPS): Understanding Interest Rate Measurement
- Baby Bonds: A Comprehensive Guide to Investing in Children's Futures
- Understanding Bonds: A Comprehensive Guide for Investors
- Understanding Commodities: A Beginner's Guide to Investing
- Day Orders: A Comprehensive Guide for Investors
- Day Trading Explained: Strategies, Risks & How It Works
- Defensive Industries: Stability in Economic Uncertainty | [Your Company Name]
- Understanding Forward Points: A Guide for Investors
- Understanding Basis Points: A Simple Guide
-
 Understanding Historical Returns: A Guide for Investors
The historical return of a financial asset, such as a bond, stock, security, index, or fund, is its past rate of return and performance. The historical data is commonly used in financial analysisTypes...
-
 Income Stocks: A Guide to Dividend Investing
Income stocks are equity financial securities that pay regular and predictable dividendsDividendA dividend is a share of profits and retained earnings that a company pays out to its shareholders. When...