Relative Price Strength (RPS): A Technical Analysis Guide
Relative price strength (RPS), also known as relative strength, is the ratio between the price trend of a stock price compared to the price trend of the market. RPS is commonly used in technical analysisTechnical Analysis - A Beginner's GuideTechnical analysis is a form of investment valuation that analyses past prices to predict future price action. Technical analysts believe that the collective actions of all the participants in the market accurately reflect all relevant information, and therefore, continually assign a fair market value to securities. and is not to be confused with relative price index.

Quick Summary:
- Relative price strength (RPS) compares the price trend of a stock to the market.
- An RPS > 1 indicates that the stock outperformed the market, an RPS < 1 indicates that the stock underperformed the market, and an RPS = 1 indicates that the stock performed on par with the market.
- RPS can be misleading as it uses historical data and does not take into account risk.
Formula for Relative Price Strength
The formula for RPS is as follows:

Where:
- Trend price of a stock is the percentage stock price change over a period of time; and
- Trend price of the market is the percentage market change over a period of time.
Alternatively, other metrics for the denominator, such as trend price of an industry or trend price of another stock, can be used depending on what the investor wants to compare against.
Example of Relative Price Strength
John is a momentum investorMomentum InvestingMomentum investing is an investment strategy aimed at purchasing securities that have been showing an upward price trend or short-selling securities that and is looking for a stock that grows the fastest compared to the market. The trend price of three different stocks in addition to the trend price of the market is provided. Based on RPS alone, which stock would John likely choose?
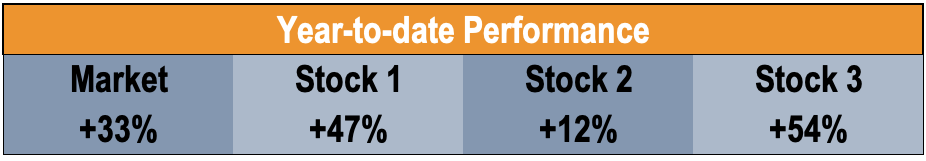
The RPS of Stock 1 is 47%/33% = 1.42.
The RPS of Stock 2 is 12%/33% = 0.36.
The RPS of Stock 3 is 54%/33% = 1.64.
Based on RPS alone, John would likely choose Stock 3.
Interpreting Relative Price Strength
Relative price strength is an indicator of price momentum. A higher RPS is always desirable. An RPS greater than 1.0 indicates that the stock outperformed the market. An RPS equal to 1.0 indicates that the stock performed identically to the market. An RPS lower than 1.0 indicates that the stock underperformed the market.
Limitations of Relative Price Strength
1. Historical data
Relative price strength uses historical data – past performance is not indicative of future performance. Therefore, a stock with a higher RPS compared to another stock does not indicate that the stock is a better pick moving forward.
2. No risk factors
Relative price strength can be a misleading indicator because it does not take risk into account. The RPS is a pure comparison between returns and does not consider the risk taken to generate that return.
RPS should not be the sole determinant used when stock-picking. Additional technical indicators, including the moving average convergence divergence (MACD)MACD Oscillator - Technical AnalysisThe MACD Oscillator is used to examine short-term moving average convergence and divergence. The MACD Oscillator is a double-edged technical indicator in that it offers traders and analysts the ability to follow trends in the market, as well as gauge the momentum of price changes., simple moving average (SMA), and relative strength index (RSI), and fundamental analysisFundamental AnalysisIn accounting and finance, fundamental analysis is a method of assessing the intrinsic value of a security by analyzing various macroeconomic and microeconomic factors. The ultimate goal of fundamental analysis is to quantify the intrinsic value of a security. should be used in conjunction with the RPS.
Investing Based on RPS
Despite the perceived lack of usefulness of the RPS – why do investors use it?
Investors use RPS because they believe it provides insight into future price momentum. The usefulness of the RPS is based on the premise of momentum – stocks with increasing RPS is assumed to continue increasing. In addition, investors believe that companies with a high RPS will attract other investors to invest in the stock (thereby increasing the stock price).
More Resources
CFI offers the Financial Modeling & Valuation Analyst (FMVA)™Become a Certified Financial Modeling & Valuation Analyst (FMVA)®CFI's Financial Modeling and Valuation Analyst (FMVA)® certification will help you gain the confidence you need in your finance career. Enroll today! certification program for those looking to take their careers to the next level. To keep learning and advancing your career, the following resources will be helpful:
- McClellan OscillatorMcClellan Oscillator - Technical AnalysisThe McClellan Oscillator is a type of momentum oscillator. The McClellan Oscillator is calculated using exponential moving averages, and is designed to indicate the strength or weakness of price movement, rather than its direction.
- Relative Strength Index (RSI)Relative Strength Index (RSI)The Relative Strength Index (RSI) is one of the most popular and widely used momentum oscillators. It was originally developed by the famed mechanical engineer turned technical analyst, J. Welles Wilder. The RSI measures both the speed and rate of change in price
- Speed LinesSpeed Lines - Technical AnalysisSpeed lines are an analysis tool used to determine support and resistance levels. They are not intended to be used as a standalone technical indicator.
- Triangle PatternsTriangle Patterns - Technical AnalysisThe triangle patterns are common chart patterns every trader should know. Triangle patterns are important because they help indicate the continuation of a bullish or bearish market. They can also assist a trader in spotting a market reversal.
-
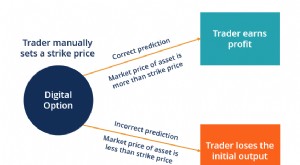
Understanding Digital Options: A Comprehensive Guide for Traders
A digital option is a form of option that allows traders to manually set a strike price. The digital option provides the traders with a fixed payout in the case when the market price of the underlying
-
Understanding Dirty Price: Bond Pricing Explained
Dirty price is when a bond price includes interest that has accrued since the latest coupon payment. When investors buy fixed-income securities, such as bondsBonds vs StocksFor prospective
invest
- Relative Strength Investing: A Guide to Identifying Top Performers
- Understanding Divergence in Technical Analysis: A Guide
- Understanding Forward Prices: Definition & How They Work
- Understanding Hedging Strategies: A Comprehensive Guide
- Kairi Relative Index (KRI): Definition & Technical Analysis
- Relative Strength Index (RSI): A Comprehensive Guide
- Selling into Strength: A Trading Strategy Explained
- Understanding Slippage in Trading: Causes & Impact
- Understanding Strangle Options: A Comprehensive Guide
-
 Understanding Dealer Markets: How Market Makers Function
A dealer market is a financial market where dealers post prices they would be willing to buy and sell specific securitiesTrading SecuritiesTrading securities are securities purchased by a company for ...
-
 Understanding Delta: A Key Risk Measure in Derivatives
Delta is a risk sensitivity measure used in assessing derivativesDerivativesDerivatives are financial contracts whose value is linked to the value of an underlying asset. They are complex financial in...