Debt-to-Assets Ratio: Definition, Calculation & Risk Assessment
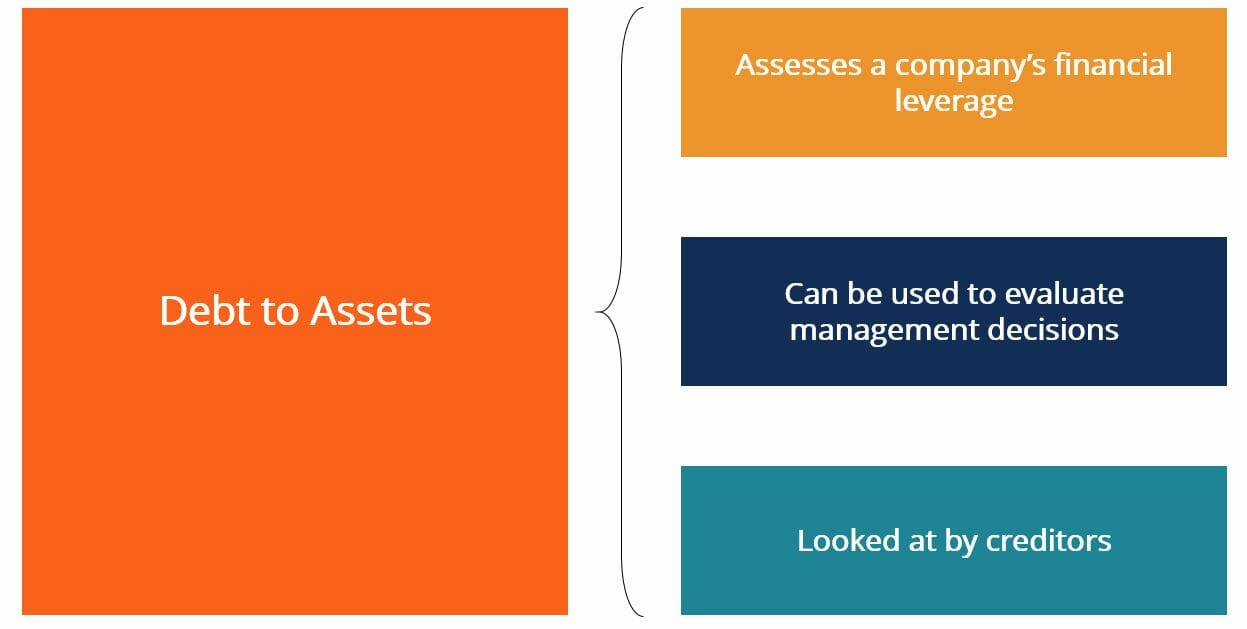
The Debt to Assets Ratio is a leverage ratioLeverage RatiosA leverage ratio indicates the level of debt incurred by a business entity against several other accounts in its balance sheet, income statement, or cash flow statement. Excel template that helps quantify the degree to which a company’s operations are funded by debt. In many cases, a high leverage ratio is also indicative of a higher degree of financial risk. This is because a company that is heavily leveraged faces a higher chance of defaulting on its loans. It is legally obligated to make periodic debt payments regardless of its sales numbers. During slow sales cycles or difficult economic times, a highly levered company may experience a loss of solvencyInsolvencyInsolvency refers to the situation in which a firm or individual is unable to meet financial obligations to creditors as debts become due. Insolvency is a state of financial distress, whereas bankruptcy is a legal proceeding. as cash reserves dwindle.
The debt to assets ratio can also be thought of as the amount of a company’s assets that have been financed by debt. It can provide insights on past decisions made by management regarding the sources of capital they selected to pursue certain projects. By extension, we can also consider the debt to assets ratio as being an indirect way of measuring management’s usage of its capital structureCapital StructureCapital structure refers to the amount of debt and/or equity employed by a firm to fund its operations and finance its assets. A firm's capital structure to fund NPV-positive projects.
How can we calculate the Debt to Assets Ratio?
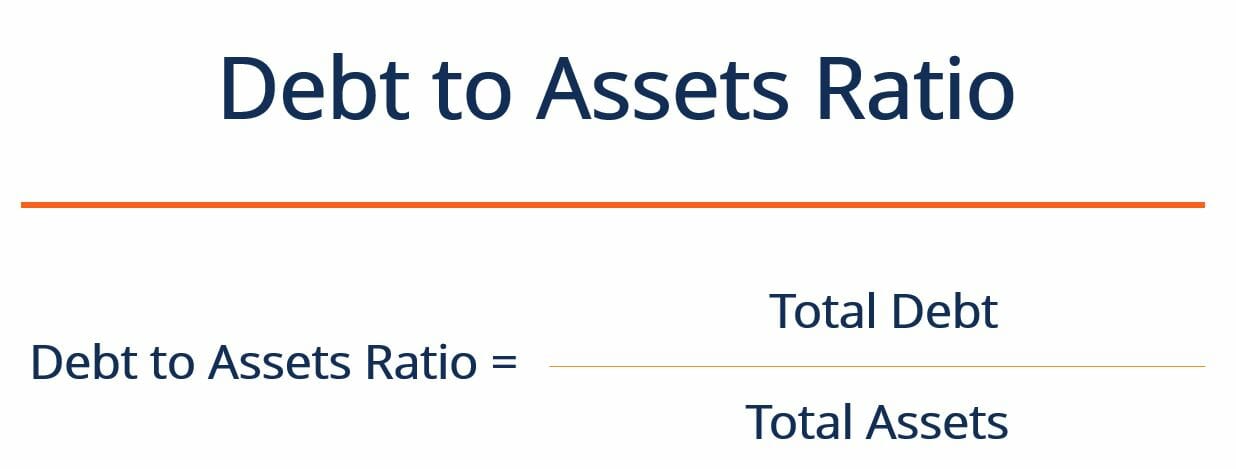
The ratio can be calculated using the following formula:
Where:
Total Debt = Short Term Debt + Long Term Debt
Total Assets = The sum of the value of all the company’s assets found on a company’s balance sheetBalance SheetThe balance sheet is one of the three fundamental financial statements. The financial statements are key to both financial modeling and accounting.
Example
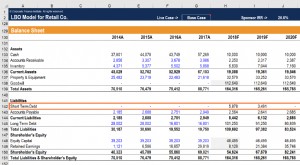
Max’s Coffee wants to calculate its debt to assets ratio in order to keep tabs on the company’s leverage. Below is the company’s balance sheet for the past few years:
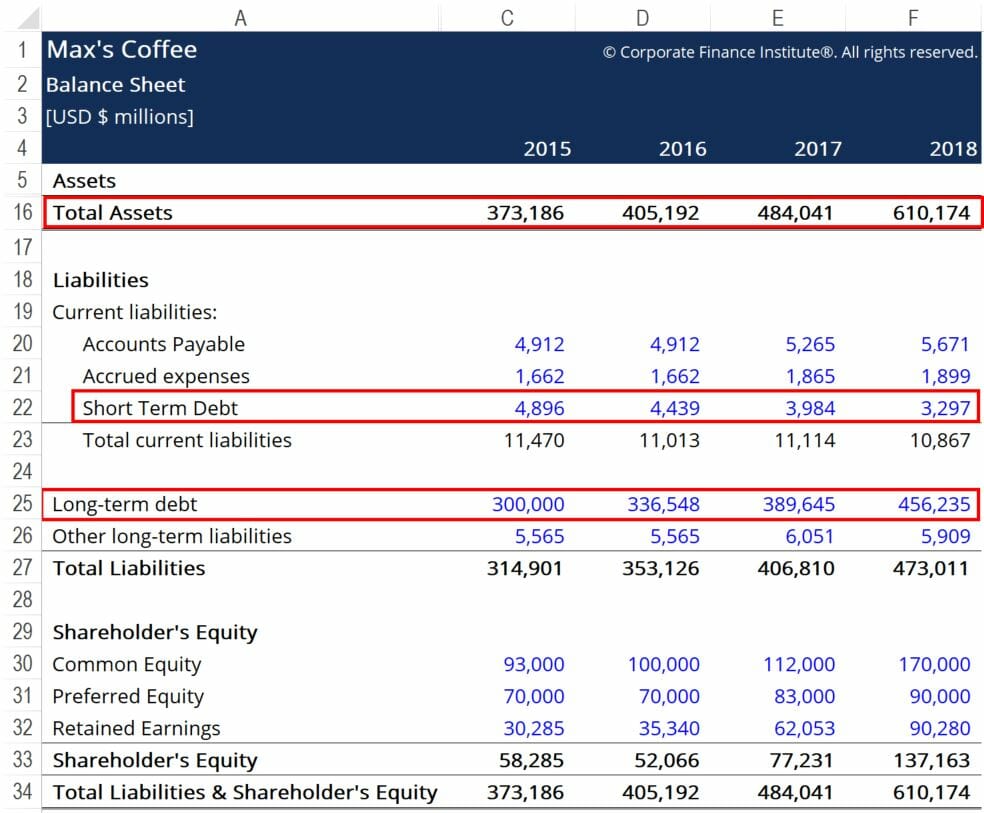
The red boxes highlight the important information that we need to calculate debt to assets, namely, short-term debt, long-term debt, and total assets. Using the formula provided above, we arrive at the following figures:
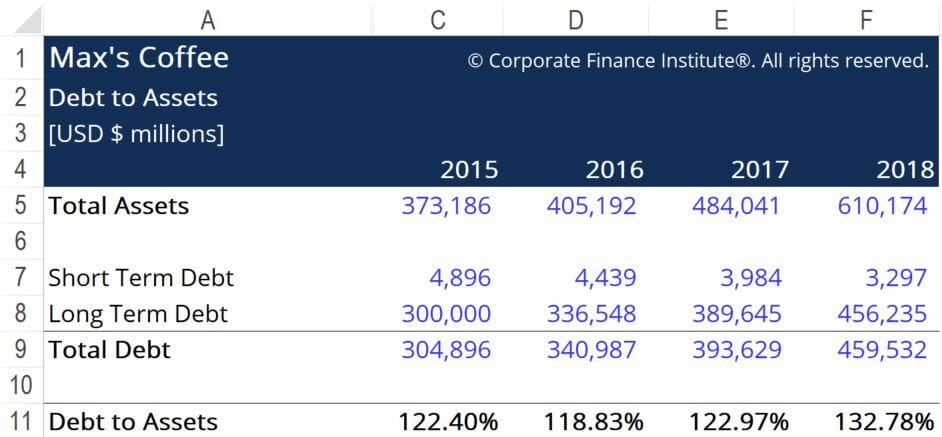
In the example above, we can see that Max’s Coffee consistently posted a debt to assets ratio of over 100%. This shows us that Max’s has more debt than it has assets that can be liquidated in the case of bankruptcy. This would typically be an indicator of poor financial health, as Max’s has a very high degree of leverage. Due to the likely very high periodic debt payments, Max’s is at a fairly high risk of defaulting on its debt. Nonetheless, if the business is able to generate strong and steady cash flows in each period, this position may be sustainable.
To better understand the financial health of the business, the ratio should be computed for a number of companies that operate in the same industry. If other firms operating in this industry see a debt to asset ratio of, say, over 200%, then we can conclude that Max’s is doing a relatively good job of managing its degree of financial leverage. In turn, creditors may be more likely to lend more money to Max’s if the company represents a fairly safe investment within the coffee industry.
Additional Resources
CFI offers the Financial Modeling & Valuation Analyst (FMVA)™Become a Certified Financial Modeling & Valuation Analyst (FMVA)®CFI's Financial Modeling and Valuation Analyst (FMVA)® certification will help you gain the confidence you need in your finance career. Enroll today! certification program for those looking to take their careers to the next level. To learn more about related topics, check out the following CFI resources:
- Leverage Effect MeasuresLeverage Effect MeasuresLeverage effect measures aim to quantify how much business risk a given company is currently experiencing. Business risk refers to the revenue variance that a business can expect to see, and how sensitive net income is to changes in revenues. Leverage effect measures aim to show how the business' fixed and variable costs can impact profitability
- Current Portion of Long-Term DebtCurrent Portion of Long-Term DebtThe current portion of long-term debt is the portion of long-term debt due that is due within a year’s time. Long-term debt has a maturity of
- Defensive Interval RatioDefensive Interval RatioThe defensive interval ratio (DIR) is a financial liquidity ratio that indicates how many days a company can operate without needing to tap into capital sources other than its current assets. It is also known as the basic defense interval ratio (BDIR) or the defensive interval period ratio (DIPR).
- How to Calculate Debt Service Coverage RatioHow to Calculate Debt Service Coverage RatioThis guide will describe how to calculate the Debt Service Coverage Ratio. First, we will go over a brief description of the Debt Service Coverage Ratio, why it is important, and then go over step-by-step solutions to several examples of Debt Service Coverage Ratio Calculations.
-

Advertising to Sales Ratio: Measuring Ad Effectiveness & ROI
The advertising to sales ratio, also called the “A to S” for short, measures the effectiveness, or how successful, a company’s advertising strategiesAIDA ModelThe AIDA model, which s
-
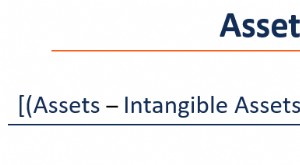
Asset Coverage Ratio: Understanding Financial Solvency
The asset coverage ratio is a financial metric that indicates how a company can potentially settle its debts by selling its tangible assetsTangible AssetsTangible assets are assets with a physical for
finance
- Cash Flow to Debt Ratio: Understanding and Calculation
- Coverage Ratio: Understanding Your Company's Debt Repayment Ability
- Understanding the Credit-Market Debt to Income Ratio
- Debt Service Coverage Ratio (DSCR): Definition & Calculation
- Debt-to-Asset Ratio: Definition, Calculation & Significance
- Debt-to-Equity Ratio: Definition, Calculation & Importance
- Net Debt to EBITDA Ratio: Understanding Financial Leverage
- Goodwill to Assets Ratio: Definition & Analysis
- Operating Cash to Debt Ratio: Understanding Financial Health
-
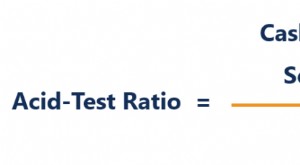 Acid-Test Ratio: Understanding Your Company's Short-Term Liquidity
The Acid-Test Ratio, also known as the quick ratioQuick RatioThe Quick Ratio, also known as the Acid-test, measures the ability of a business to pay its short-term liabilities with assets readily conv...
-
 Understanding Current Debt: Definition & Implications
Current debt includes the formal borrowings of a company outside of accounts payableAccounts PayableAccounts payable is a liability incurred when an organization receives goods or services from its su...