Molodovsky Effect: Understanding Market Inverted Cycles
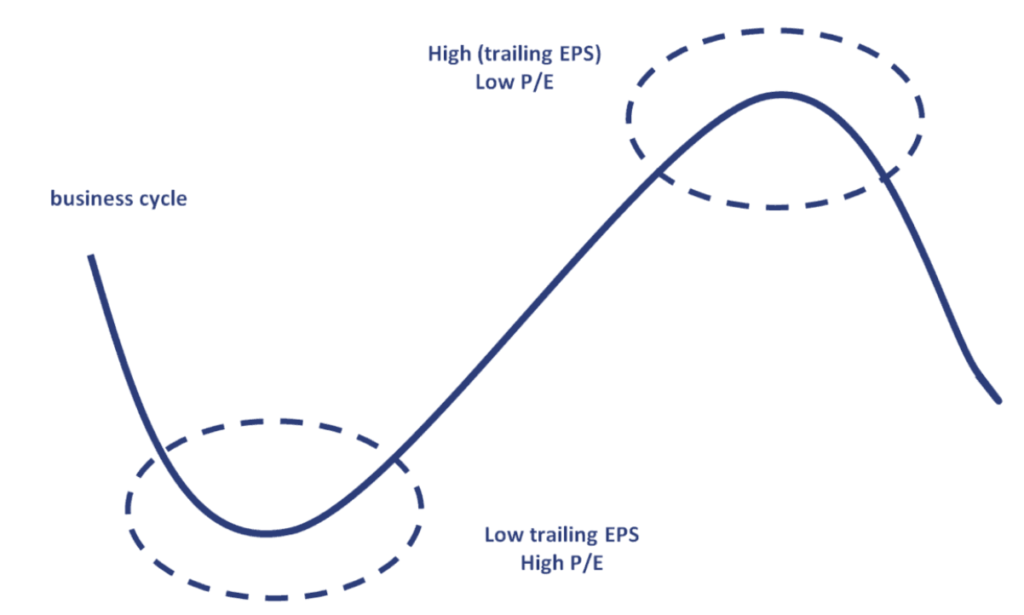
The Molodovsky Effect is the imperial observation by Nicholas Molodovsky that at the bottom of an economic cycleEconomic CycleThe economic cycle is the fluctuating state of an economy from periods of economic expansion and contraction. It is usually measured with the, P/E ratios are high, and earnings are low. However, at the top of an economic cycle where there is an economic boom, the P/E ratios are low, and earnings are high.
The Molodovsky Effect came to light in 1953 when Nicholas Molodovsky published the article “A Theory of Price Earnings Ratio” in the Financial Analyst Journal. It occurs because when the economic cycle is at the bottom, companies are generally earning less. Thus, the denominator of the P/E ratio decreases, pushing the P/E ratio up.
Furthermore, it is said that the decrease in the earnings outweighs the price decrease, which pushes the P/E ratio up. In contrast, when the economic cycle is at its peak and companies’ earnings are high, the denominator of the P/E ratio increases, which puts downward pressure on the P/E ratio.
It is counterintuitive against the belief that growth stocksGrowth StocksGrowth stocks are stocks that offer a substantially higher growth rate as opposed to the mean growth rate prevailing in the market. It means that a growth demonstrate high P/E ratios and value stocksValue StocksValue stocks are stocks that are currently trading at a price lower than their actual intrinsic price. It basically means that the stocks are undervalued, take on low P/E ratios. The earnings in the P/E ratio are forward-looking; growth stocks with higher future earnings would see a lower P/E ratio, whereas value stocks with lower future earnings would generate a higher P/E ratio.
The Molodovsky Effect and P/E Ratios
P/E ratios are calculated by dividing the current price of a stock by its current earnings or expected earnings. Using expected earnings to calculate the P/E ratio would yield the forward P/E ratio. However, using a time-weighted average P/E ratio or the CAPE ratioCAPE RatioThe CAPE Ratio (also known as the Shiller P/E or PE 10 Ratio) is an acronym for the Cyclically-Adjusted Price-to-Earnings Ratio. The ratio is calculated by dividing a company's stock price by the average of the company's earnings for the last ten years, adjusted for inflation. would not be effective in analyzing the Molodovsky Effect.
The CAPE ratio refers to the cyclically adjusted price-to-earnings ratio and is calculated by dividing the stock’s price by the average earnings over the past ten years. The ratio can be used to filter out any noise in the P/E ratio data, such as anomalies, seasonal changes in stock, or fluctuations throughout the economic cycles.
Since the CAPE ratio or a time-weighted P/E ratio (average 20-year P/E ratio) adjusts for fluctuations in the economic cycle, it should not be used to analyze the Molodovsky Effect. Instead, a shorter-term P/E ratio should be used to be able to analyze such an effect.
Issues with the Molodovsky Effect
The main issue with the Molodovsky Effect is that it may not always hold or be correct for certain stocks. For example, some industries are not impacted negatively by economic downturns and consequently generate steady or strong earnings, which would not push their P/E ratio up.
Also, with an increase in participation in capital markets and improvements in technology and liquidity, the Molodovsky Effect may not be as prevalent.
The Molodovsky Effect in Practice
In practice, the Molodovsky effect is not referred to excessively. However, it is something that analysts and researchers should be aware of when researching or analyzing stocks.
Also, it is useful to understand how the Molodovsky Effect works in different industries. It can also be a useful tool when comparing stocks or industries.
Summary
- The Molodovsky Effect was first published in 1953 by Nicholas Molodovsky in the Financial Analyst Journal.
- At the bottom of an economic cycle, earnings tend to be low, which puts upward pressure on the P/E ratio.
- At the top of an economic cycle, earnings tend to be high, which puts downward pressure on the P/E ratio.
- Short-term P/E ratios are ideal for observing the Molodovsky Effect. In contrast, time-weighted P/E ratios or the CAPE ratio would flatten out any cyclical changes in the economy and make the Molodovsky Effect unobservable.
Related Readings
CFI is the official provider of the Certified Banking & Credit Analyst (CBCA)®Program Page - CBCAGet CFI's CBCA™ certification and become a Commercial Banking & Credit Analyst. Enroll and advance your career with our certification programs and courses. certification program, designed to transform anyone into a world-class financial analyst.
To keep learning and developing your knowledge of financial analysis, we highly recommend the additional resources below:
- Business CycleBusiness CycleA business cycle is a cycle of fluctuations in the Gross Domestic Product (GDP) around its long-term natural growth rate. It explains the
- Price to Earnings RatioPrice Earnings RatioThe Price Earnings Ratio (P/E Ratio is the relationship between a company’s stock price and earnings per share. It provides a better sense of the value of a company.
- Economic CycleEconomic CycleThe economic cycle is the fluctuating state of an economy from periods of economic expansion and contraction. It is usually measured with the
- Industry AnalysisIndustry AnalysisIndustry analysis is a market assessment tool used by businesses and analysts to understand the complexity of an industry. There are three commonly used and
-

Inventory Turnover Ratio: Definition & Calculation
The inventory turnover ratio, also known as the stock turnover ratio, is an efficiency ratio that measures how efficiently inventoryInventoryInventory is a current asset account found on the bala
-
Loan-to-Value (LTV) Ratio: Understanding Risk & Home Equity
The loan-to-value (LTV) ratio is a financial ratio that compares the size of a loan to the value of an asset that is purchased using the proceeds of the loan. The LTV ratio is an important metric that
finance
- Current Ratio: Definition, Calculation & Financial Health
- Understanding the Justified P/E Ratio: A Deep Dive
- Operating Ratio: Definition, Calculation & Importance
- Quick Ratio: Understanding Your Business's Short-Term Liquidity
- Reserve Ratio Explained: Understanding Bank Reserves
- Understanding the Retention Ratio: Reinvesting for Growth
- Sharpe Ratio: Calculate & Interpret Investment Performance
- Understanding the Price-to-Earnings (P/E) Ratio: A Beginner's Guide
- Understanding the Price-to-Earnings (P/E) Ratio: A Comprehensive Guide
-
 Gross Margin Ratio: Definition & Calculation | [Your Brand/Website]
The Gross Margin Ratio, also known as the gross profit margin ratio, is a profitability ratioProfitability RatiosProfitability ratios are financial metrics used by analysts and investors to measure an...
-
 Information Ratio: A Comprehensive Guide to Risk-Adjusted Returns
The information ratio measures the risk-adjusted returns of a financial asset or portfolio relative to a certain benchmarkDow Jones Industrial Average (DJIA)The Dow Jones Industrial Average (DJIA), al...