Cash Flow to Debt Ratio: Understanding and Calculation
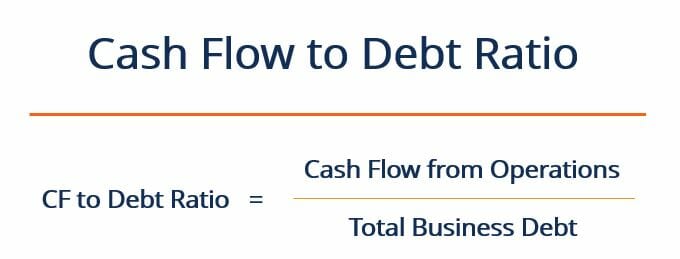
The cash flow to debt ratio is a coverage ratio that compares the cash flow that a business generates to its total debt. The cash flow most commonly used to calculate the ratio is the cash flow from operationsOperating Cash FlowOperating Cash Flow (OCF) is the amount of cash generated by the regular operating activities of a business in a specific time period., although using unlevered free cash flowUnlevered Free Cash FlowUnlevered Free Cash Flow is a theoretical cash flow figure for a business, assuming the company is completely debt free with no interest expense. is also a viable option.
Some businesses may opt to use their EBITDA number in the calculation. However, this is not recommended, since EBITDAEBITDAEBITDA or Earnings Before Interest, Tax, Depreciation, Amortization is a company's profits before any of these net deductions are made. EBITDA focuses on the operating decisions of a business because it looks at the business’ profitability from core operations before the impact of capital structure. Formula, examples takes into account new inventory purchases that may take a long time to be sold and generate cash flow.

How to Calculate the Cash Flow to Debt Ratio
The ratio is calculated by dividing the business’ cash flow from operations by its total debt:
The cash flow to debt ratio is expressed as a percentage, but can also be expressed in years by dividing 1 by the ratio. This would tell us how many years it would take the business to pay off all of its debtCurrent DebtOn a balance sheet, current debt is debts due to be paid within one year (12 months) or less. It is listed as a current liability and part of if it were to devote all cash flow generated from operations to repaying debt.
For example, if a company’s ratio is 20%, then it could, theoretically, pay off all its outstanding debt in five years.
1 divided by 0.2 = 5
Another way of thinking about the cash flow to debt ratio is that it shows how much of a business’ debt could be paid off in one year if all cash flows were devoted to debt repayment. In this example, the answer would be 20%. However, practically speaking, it’s unrealistic to envision a business dedicating 100% of its operational cash to debt repayment.
Example
Assume a company has total debts equal to $1.5 million. Its cash flow from operations in the past year was $350,000. The company’s cash flow to debt ratio would be calculated as follows:
$350,000 ÷ $1,500,000 = 0.23 or 23%
A ratio of 23% indicates that it would take the company between four and five years to pay off all its debt, assuming constant cash flows for the next five years.
A high cash flow to debt ratio indicates that the business is in a strong financial position and is able to accelerate its debt repayments if necessary. Conversely, a low ratio means the business may be at a greater risk of not making its interest payments, and is on a comparably weaker financial footing.
To define what a “high” or “low” ratio is, we must compare it to the ratio of other companies in the same industry. The ratio can also be looked at historically for a business, indicating how its debt coverage ability has changed over the course of time.
Other Considerations
In the calculation of the cash flow to debt ratio, analysts do not typically use the cash flow from financing or cash flow from investing. If the business has a highly leveraged capital structure, it is likely that the business has a fair amount of debt to pay off. It would not make sense to assume that the business was paying off its debt using its debt capital. Therefore, the cash flow from financing is not used in the calculation.
Cash flow from investing activities is also not commonly used in the calculation of the ratio since investing activities are not part of the business’ core cash-generating activities. It is thought better to use a cash flow number that is more representative of the business’ day-to-day activities. Two good options are cash flow from operations or unlevered free cash flow.
Additional Resources
CFI offers the Financial Modeling & Valuation Analyst (FMVA)™Become a Certified Financial Modeling & Valuation Analyst (FMVA)®CFI's Financial Modeling and Valuation Analyst (FMVA)® certification will help you gain the confidence you need in your finance career. Enroll today! certification program for those looking to take their careers to the next level. To learn more about related topics, check out the following CFI resources:
- How to Calculate Debt Service Coverage RatioHow to Calculate Debt Service Coverage RatioThis guide will describe how to calculate the Debt Service Coverage Ratio. First, we will go over a brief description of the Debt Service Coverage Ratio, why it is important, and then go over step-by-step solutions to several examples of Debt Service Coverage Ratio Calculations.
- Current Portion of Long-Term DebtCurrent Portion of Long-Term DebtThe current portion of long-term debt is the portion of long-term debt due that is due within a year’s time. Long-term debt has a maturity of
- IFRS StandardsIFRS StandardsIFRS standards are International Financial Reporting Standards (IFRS) that consist of a set of accounting rules that determine how transactions and other accounting events are required to be reported in financial statements. They are designed to maintain credibility and transparency in the financial world
- Cash Flow StatementCash Flow StatementA cash flow Statement contains information on how much cash a company generated and used during a given period.
-

Operating Ratio: Definition, Calculation & Importance
The operating ratio is a measure of efficiency that is used by management to determine day-to-day operational performance. This metric compares operating expenses, also known as OPEX, to net sales. Th
-

Quick Ratio: Understanding Your Business's Short-Term Liquidity
The Quick Ratio, also known as the Acid-test or Liquidity ratio, measures the ability of a business to pay its short-term liabilities by having assets that are readily convertible into cashCash Equiva
finance
- Cash Conversion Ratio (CCR): Definition & Importance
- Understanding Cash Flow: A Comprehensive Guide
- Cash Ratio: Understanding Your Company's Short-Term Liquidity
- Cash Turnover Ratio (CTR): Calculation & Interpretation
- Debt-to-Assets Ratio: Definition, Calculation & Risk Assessment
- Debt-to-Equity Ratio: Definition, Calculation & Importance
- Understanding the Operating Cash Flow Ratio: A Key Liquidity Metric
- Operating Cash to Debt Ratio: Understanding Financial Health
- Price-to-Cash Flow Ratio (P/CF): Definition & Analysis
-
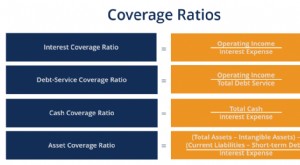 Coverage Ratio: Understanding Your Company's Debt Repayment Ability
A Coverage Ratio is any one of a group of financial ratios used to measure a company’s ability to pay its financial obligationsDebt CapacityDebt capacity refers to the total amount of debt a bus...
-
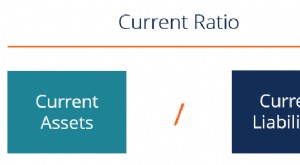 Current Ratio: Definition, Calculation & Financial Health
The current ratio, also known as the working capitalNet Working CapitalNet Working Capital (NWC) is the difference between a companys current assets (net of cash) and current liabilities (net of debt)...