Understanding the Joseph Effect: Trends vs. Randomness
The Joseph Effect, which derives its name from a Biblical reference, is a phrase created by Benoit Mandelbrot, a Polish-born French-American mathematician. The phrase asserts that variations over time are normal and often part of wider trends and patterns, instead of being random. In essence, the Joseph Effect indicates whether variations in prices form part of a long-term trend. The measure is founded on the assumption that future events are greatly influenced by past events.

Summary
- The Joseph Effect, which derives its name from a Biblical reference, is a phrase created by Benoit Mandelbrot, a Polish-born French-American mathematician.
- The Joseph Effect indicates whether variations in prices form part of a long-term trend. It is founded on the assumption that future events are greatly influenced by past events.
- The Joseph Effect makes reference to a verse in the Old Testament, which tells a story or recollection of a dream of a Pharaoh, as told by Joseph.
The Biblical Reference
The Joseph Effect makes reference to a verse in the Old Testament, which tells a story or recollection of a dream of a Pharaoh, as told by Joseph. The Pharaoh’s dream consisted of seven fat cows and seven lean cows, and in the dream, the fat cows were being consumed or eaten by the lean cows.
Hence, Benoit derived his theologies from the Biblical reference, following an interpretation that seven bad years would follow seven good years (crop harvesting). The seven good years are what is referred to as “The Joseph Effect,” whereas the seven bad years are termed “The Noah Effect.”
How the Joseph Effect Works
In mathematics (and/or statistics), the Joseph Effect can be quantified through the Hurst exponent. The Hurst exponent is typically used to measure the degree (or how much) of correlation of a series of prices (i.e., how much the prices are correlated with one another). It measures the regressionMultiple Linear RegressionMultiple linear regression refers to a statistical technique used to predict the outcome of a dependent variable based on the value of the independent variables. toward the average over time for a series of price variations.
A Hurst exponent that falls between 0 and 0.5 shows that the data points in a series are not strongly correlated; therefore, they are not indicative of a long-term trend. A Hurst exponent that falls above 0.5 shows that the data points in a series are correlated and, therefore, indicate that the data points form part of a long-term pattern/trend.
The Hurst Exponent
The Hurst exponent is a statistical measure of a time series’ tendency to revert to a long-term pattern or equilibrium. The value for the exponent ranges from zero (0) to one (1).
- A Hurst exponent of zero (0) indicates that any positive movement in the data points of a time series is directly followed by a negative movement in the data points. Hence, the long-term equilibrium remains constant.
- A Hurst exponent of one (1) indicates a trending time-series. Any notable positive or negative movement in the data points of a time series is directly followed by a notable positive or negative movement in the data points.
- A Hurst exponent of 0.5 indicates that there is no correlation between a variable or data point with a past value. It is also known as a Brownian Motion.
Applications of the Joseph Effect
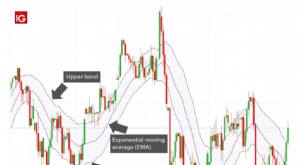
The Joseph Effect is commonly used by investors to perform trend analysis, as the measure can be used to determine whether there is an existing trend that persists over time. When performing technical analysisTechnical Analysis - A Beginner's GuideTechnical analysis is a form of investment valuation that analyses past prices to predict future price action. Technical analysts believe that the collective actions of all the participants in the market accurately reflect all relevant information, and therefore, continually assign a fair market value to securities., investors study existing trends (volume) and price variations.
Additional Resources
CFI is the official provider of the global Capital Markets & Securities Analyst (CMSA)®Program Page - CMSAEnroll in CFI's CMSA® program and become a certified Capital Markets &Securities Analyst. Advance your career with our certification programs and courses. certification program, designed to help anyone become a world-class financial analyst. To keep advancing your career, the additional CFI resources below will be useful:
- Advanced Technical AnalysisAdvanced Technical AnalysisAdvanced technical analysis usually involves using either multiple technical indicators or a rather sophisticated (i.e., complex) indicator. "Sophisticated"
- Bullish and BearishBullish and BearishProfessionals in corporate finance regularly refer to markets as being bullish and bearish based on positive or negative price movements. A bear market is typically considered to exist when there has been a price decline of 20% or more from the peak, and a bull market is considered to be a 20% recovery from a market bottom.
- Regression AnalysisRegression AnalysisRegression analysis is a set of statistical methods used to estimate relationships between a dependent variable and one or more independent variables.
- Triangle PatternsTriangle Patterns - Technical AnalysisThe triangle patterns are common chart patterns every trader should know. Triangle patterns are important because they help indicate the continuation of a bullish or bearish market. They can also assist a trader in spotting a market reversal.
-

Kelly Criterion: A Guide to Optimal Betting & Investment Strategy
Kelly criterion is a mathematical formula for bet sizing, which is frequently used by investors to decide how much money they should allocate to each investment or bet through a predetermined fraction
-
Keltner Channel: Definition, How to Use & Trading Strategies
Keltner Channel refers to a technical analysis indicator composed of three separate lines. It includes a central moving average line along with channel lines located above and below the central one.&n
invest
- Understanding the Investment Accumulation Phase: Building Wealth Over Time
- Bandwagon Effect: Understanding Social Influence & Conformity
- Clientele Effect: How Investor Preferences Impact Stock Prices
- Dow 30 Explained: Understanding the Dow Jones Industrial Average
- Understanding the Hamptons Effect: Trading Trends & Labor Day
- Understanding the January Effect: Stock Market Trends & Causes
- Rule of 72: Calculate Investment Doubling Time | [Your Brand Name]
- Understanding the Wealth Effect: How Rising Asset Values Impact Spending
- Nifty 50: History, Significance & Key Stocks - A Comprehensive Guide
-
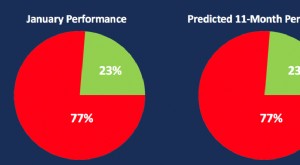 January Barometer: Predicting Market Performance - Explained
The January Barometer is the idea that the investment performance of the S&P 500S&P 500 IndexThe Standard and Poor’s 500 Index, abbreviated as S&P 500 index, is an index comprising t...
-
 K-Ratio Explained: Measuring Investment Growth & Consistency
The K-Ratio is a statistical tool that helps us measure two things – the growth of return and the consistency of that growth over a specified period. It is often used to determine the risk vs. r...