Volume Price Trend Indicator (VPT): A Comprehensive Guide
The Volume Price Trend Indicator (VPT) is a stock market indicator that helps traders relate a stock’s price and trading volume. It helps in identifying the parity between the supply and demandSupply and DemandThe laws of supply and demand are microeconomic concepts that state that in efficient markets, the quantity supplied of a good and quantity for a stock and also helps in predicting the price of a stock, both in direction and magnitude.
The VPT is different from other price-volume indicators due to the fact that it takes into consideration the percentage increase or decrease in price and not just add or subtract the volume based on whether the current price is higher than the previous day’s price.
Summary
- The Volume Price Trend indicator (VPT), sometimes known as the Price-Volume Trend, combines price and volume to form an indicator that uses changes in money flow as entry and exit points in trading.
- It uses percentage price change and not price change for its calculation.
- In trading, the VPT, along with other moving averages, is used for signal line crossovers, confirmations, and divergences.
Formula for Calculating the Volume Price Trend Indicator
VPT = Previous VPT + Volume x (Today’s Closing Price – Previous Closing Price) / Previous Closing Price
The idea behind the indicator is to multiply the market volume of a stock by the percentage change in its price. If the price of the stock declines, the value of the indicator falls. If the price increases, the value rises. The VPT is generally calculated on a daily basis, though it can be measured over any timeframe with which volume dataVolume of TradeVolume of trade, also known as trading volume, refers to the quantity of shares or contracts that belong to a given security traded on a daily basis is available.
The VPT is very similar to on-balance volume (OBV). In OBV, there is an increase or decrease in the indicator based on only price movements. The percentage move in price is not considered in the calculation. However, in VPT, the indicator moves based on the percentage shift in price.
Interpreting the VPT
When investors and traders look at the VPT, they are usually for divergences. A divergence is when the price of a stock moves in the opposite direction of an indicator. It usually suggests that there may be a change in the direction of the price.
For example, if volume remains constant, but there is an increase in price, it usually suggests that the price movement is weak, and there is a high chance of it being reversed. A trader who uses VPT and observes the fact, may not pursue long trades, expecting the market to go up further.
The interpretations of the VPT can be summed up as follows:
- An increase in price, as well as volume, confirms the price trend upward.
- A decrease in price, as well as volume, confirms the price trend downward.
- An increase in price accompanied by a decreasing or flat volume trend is a divergence and may suggest that the downward price movement is weak and won’t hold.
- A decrease in price accompanied by an increasing or flat volume trend is a divergence and may suggest that the upward price movement is weak and won’t hold.
Trading with the VPT
In technical analysis, the VPT is used mainly on longer-term frames due to its cumulative nature. It becomes difficult to use it on the short-term and intraday charts as the changes can be relatively small when compared to the actual VPT value. The problem persists with all volume-based indicators that use cumulative calculation.
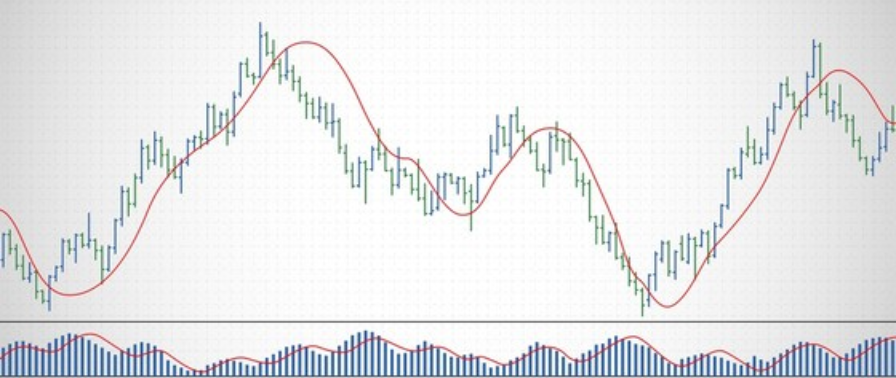
To simplify the analysis, it is recommended to use the VPT indicator along with a moving averageMoving AverageA moving average is a technical indicator that market analysts and investors may use to determine the direction of a trend. It sums up the data points applied to it as a signal line. When a moving average is used, VPT values below the line would suggest negative money flow and to sell, whereas VPT values above the line would suggest positive money flow and to buy.
The VPT can also be used with the average directional index (ADX)ADX Indicator - Technical AnalysisADX stands for average directional movement index. The ADX indicator is an indicator of trend strength, commonly used in futures trading. However, it has since been widely applied by technical analysts to virtually every other tradeable investment, from stocks to forex to ETFs. to confirm the market trend. The VPT is basically used in conjunction with the 25- to 50-day moving averages. If the moving averages and the VPT are moving in the same direction, then a trader may decide to buy and vice-versa.
Like all technical trading tools, VPT is best used in conjunction with other tools than on its own. Using an indicator independently to make trading decisions will be a form of misuse. The indicators are best used as guides for trading decisions rather than standalone systems.
Additional Resources
CFI is the official provider of the Capital Markets & Securities Analyst (CMSA)®Program Page - CMSAEnroll in CFI's CMSA® program and become a certified Capital Markets &Securities Analyst. Advance your career with our certification programs and courses. certification program, designed to transform anyone into a world-class financial analyst.
To keep learning and developing your knowledge of financial analysis, we highly recommend the additional resources below:
- Advance Technical AnalysisAdvanced Technical AnalysisAdvanced technical analysis usually involves using either multiple technical indicators or a rather sophisticated (i.e., complex) indicator. "Sophisticated"
- Golden CrossGolden CrossA Golden Cross is a basic technical indicator that occurs in the market when a short-term moving average (50-day) of an asset rises above a long-term moving average (200-day). When traders see a Golden Cross occur, they view this chart pattern as indicative of a bull market.
- Kaufman’s Adaptive Moving Average (KAMA) Kaufman’s Adaptive Moving Average (KAMA)Kaufman’s Adaptive Moving Average (KAMA) was developed by American quantitative financial theorist, Perry J. Kaufman, in 1998. The technique began in 1972 but Kaufman officially presented it to the public through his book, "Trading Systems and Methods." Unlike other moving averages
- McClellan OscillatorMcClellan Oscillator - Technical AnalysisThe McClellan Oscillator is a type of momentum oscillator. The McClellan Oscillator is calculated using exponential moving averages, and is designed to indicate the strength or weakness of price movement, rather than its direction.
-
Slow Stochastic Indicator: Definition, Calculation & Interpretation
The slow stochastic indicator is a technical momentum indicator that aims to measure the trend in prices and identify trend reversals. George Lane developed the indicator, which is driven by two param
-
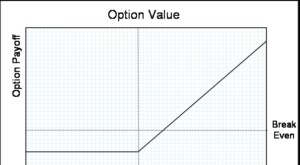
Understanding Strike Price: Options Trading Explained
The strike price is the price at which the holder of the option can exercise the option to buy or sell an underlying security, depending on whether they hold a call optionCall OptionA call option, com
invest
- Accumulation/Distribution (A/D) Indicator: A Comprehensive Guide
- Arms Index (TRIN): Understanding Short-Term Market Sentiment
- Black-Scholes Model: Understanding Stock Option Pricing
- Double Top Pattern: Definition, Trading Signals & Analysis
- Net Volume Explained: Understanding Market Sentiment
- On-Balance Volume (OBV): Understanding Trading Momentum
- Technical Indicators: A Comprehensive Guide for Traders
- Volume Analysis: A Comprehensive Guide for Traders & Investors
- Vortex Indicator (VI): A Comprehensive Guide for Trend Analysis
-
 Understanding Offering Price: A Guide for Investors
The offering price is the per share price of publicly issued securities set by an underwriter and at which the shares are available for purchase. Although the term is mostly used in the context of the...
-
 Understanding Quoted Prices: A Comprehensive Guide
The quoted price is the most recent – or last – price at which a financial assetFinancial AssetsFinancial assets refer to assets that arise from contractual agreements on future cash flows...