Slow Stochastic Indicator: Definition, Calculation & Interpretation
The slow stochastic indicator is a technical momentum indicator that aims to measure the trend in prices and identify trend reversals. George Lane developed the indicator, which is driven by two parameters – the lookback period and the smoothing parameter.
The lookback period is the period over which the oscillator is calculated, and the smoothing parameter is the number of periods over which the moving average of the oscillator is calculated. It is called an oscillator because the value of the indicator oscillates between 0 and 100. It can be computed as follows:
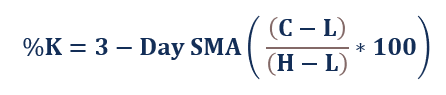
Where:
- C = Current price
- L = Period low
- H = Period high
- %K = The slow oscillator computed as the 3-day simple moving average (SMA) of the fast oscillator
The lookback period is usually 5 days or 14 days, but it can be any number between 5 days and 21 days. The indicator is not effective over longer periods because, over longer periods, stock prices tend to have an upward trend.
There is also a second quantity computed known as %D, which is the 3-day SMA of the %K. It is a smoothed version of the %K. It is computed because %K is a volatile indicator and can lead to spurious signals. A smoothed version (%D) moves much slower than the %K; hence, the signals generated are indicative of a stronger trend.
How to Interpret
The Slow Stochastic Oscillator (%K) is a momentum indicatorMomentum IndicatorsMomentum indicators are tools utilized by traders to get a better understanding of the speed or rate at which the price of a security changes. Momentum, and it is used to identify the strength of trends in price movements. It can be used to generate overbought and oversold signals. Typically, a stock is considered overbought if the %K is above 80 and oversold if %K is below 20. Other widely used levels are 75 and 25, respectively.
The levels may be used as buy (%K below 20) or sell (%K above 80) to create a simple mechanical trading strategy. In practice, these thresholds are used in combination with other indicators and serve as warning signals.
Excel Tutorial
The Slow Stochastic Indicator can be easily computed using Excel. The following is a short tutorial on how to calculate the indicator.
Step 1: Collect the daily closing prices of the index or the stock to study.
Step 2: Calculate the Fast Stochastic Oscillator over the desired lookback period (5-21 days). Use the MIN() and MAX() functions to calculate the low price (L) and high price (H), respectively. Compute the Fast %K using the above formula.
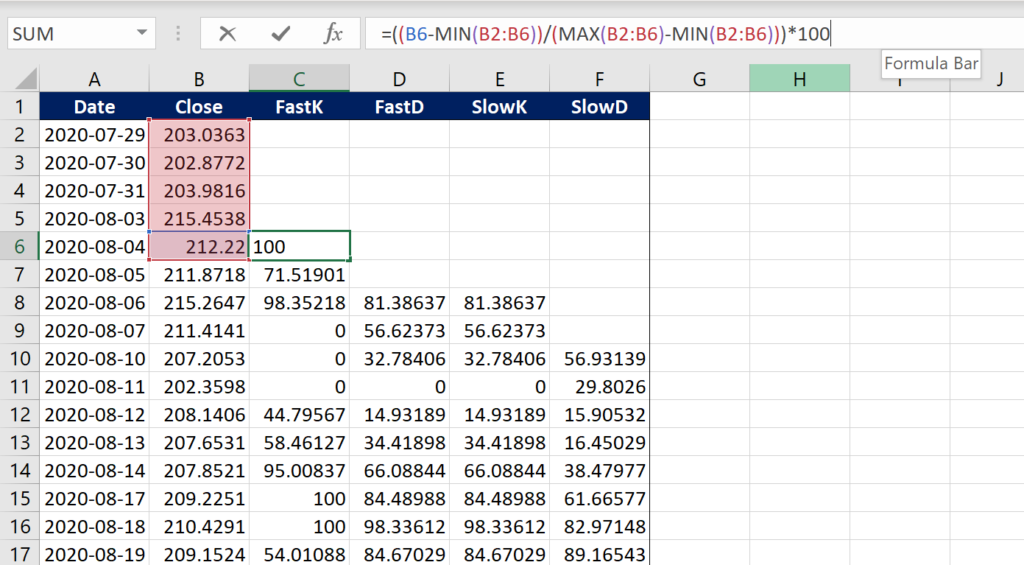
Step 3: Compute the 3-day simple moving average of the Fast Stochastic oscillator (Fast %K) to get the Slow %K.
Step 4: Finally, compute the 3-day simple moving average of the Slow %K. It is the Slow %D.
To learn more about George Lane’s trading strategy, check out our article on Fast Stochastic IndicatorFast Stochastic IndicatorThe fast stochastic indicator is a momentum technical indicator that aims to measure the trend in prices and identify trend reversals..
Additional Resources
CFI is the official provider of the global Capital Markets & Securities Analyst (CMSA)®Program Page - CMSAEnroll in CFI's CMSA® program and become a certified Capital Markets &Securities Analyst. Advance your career with our certification programs and courses. certification program, designed to help anyone become a world-class financial analyst. To keep advancing your career, the additional CFI resources below will be useful:
- Advanced Technical AnalysisAdvanced Technical AnalysisAdvanced technical analysis usually involves using either multiple technical indicators or a rather sophisticated (i.e., complex) indicator. "Sophisticated"
- Stochastic ModelingStochastic ModelingStochastic modeling is used to estimate the probability of various outcomes while allowing for randomness in one or more inputs over time.
- Technical IndicatorTechnical IndicatorA technical indicator is a mathematical pattern derived from historical data used by technical traders or investors to predict future price
- Weighted Moving AverageWeighted Moving Average (WMA)The weighted moving average (WMA) is a technical indicator that traders use to generate trade direction and make a buy or sell decision. It assigns greater
-

Understanding the Healthcare Sector: Key Overview & Importance
The healthcare sector is one of 11 S&P sectors or GICS (Global Industry Classification Standard) used by the financial community. It is consistently in the top three most weighted sectors of the S
-

Understanding Implied Rates: A Comprehensive Guide
The implied rate is an interest rate that expresses the difference between the forward/future rate and the spot rate. It serves as a useful tool for comparing returns across different assets and can b
invest
- Dow 30 Explained: Understanding the Dow Jones Industrial Average
- Fast Stochastic Indicator: Definition, Calculation & Trading Strategies
- Fractal Indicator: Identify Trend Reversals in Trading
- Harvard MBA Indicator: A Guide to Investment Opportunities
- Understanding the -DI: A Guide to Negative Directional Indicators
- On-Balance Volume (OBV): Understanding Trading Momentum
- Qstick Indicator: Definition, Calculation & Trading Strategies
- Stochastic Oscillator: Understanding Momentum & Trading Signals
- Vortex Indicator (VI): A Comprehensive Guide for Trend Analysis
-
 Understanding the Dow Divisor: How It Impacts the DJIA
The Dow divisor, in simple terms, is a number used to help calculate the Dow Jones Industrial Average (DJIA)Dow Jones Industrial Average (DJIA)The Dow Jones Industrial Average (DJIA), also referred to...
-
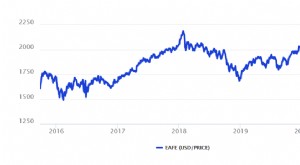 EAFE Index: Understanding Developed Market Performance
The EAFE Index (Europe, Australasia, and the Far East) was created to measure the performance of the stock markets in developed markets – excluding the U.S. and Canada. The indicator is maintain...