Parabolic SAR (SAR): Understanding a Key Trading Indicator
The Parabolic SAR is a technical indicator developed by J. Welles Wilder to determine the direction that an asset is moving. The indicator is also referred to as a stop and reverse system, which is abbreviated as SAR. It aims to identify potential reversals in the price movement of traded assets. It can also be used to provide entry and exit points.
The Parabolic SAR mainly works in trending markets. Wilder recommends traders should first establish the direction of the trend using the parabolic SAR and then use alternative indicators to measure the strength of the trend.
When graphically plotted on a chart, the Parabolic SAR indicator is displayed as a series of dots. If it appears below the current price, the parabolic SAR is interpreted as a bullishBullish and BearishProfessionals in corporate finance regularly refer to markets as being bullish and bearish based on positive or negative price movements. A bear market is typically considered to exist when there has been a price decline of 20% or more from the peak, and a bull market is considered to be a 20% recovery from a market bottom. signal. When it is positioned above the current price, it is deemed to be a bearish signal. The signals are used to set stop losses and profit targets.
How Parabolic SAR works
The Parabolic SAR is usually represented in the chart of an assetTrading SecuritiesTrading securities are securities purchased by a company for the purpose of realizing a short-term profit. The securities are issued within the company's industry, as a set of dots that are placed near the price bars. Generally, when these dots are located above the price, it signals a downward trend and it is deemed to be a sell signal. When the dots move below the price, it shows that the trend of the asset is upward and signals a buy.
The change in the direction of the dots produces trade signals which can produce a profit when the price makes big swings. However, the indicator is not as reliable in a flat or ranging marekt. The movements are demonstrated in the chart below:
When the price of a security rises, the dots also rise. The pace accelerates with the trend. The Parabolic SAR works well for capturing profits by entering the trade during a trend in a steady market.
It may produce false signals when the price moves sideways, and the trader should expect small losses or small profits. The indicator can also be used used to set stop loss orders. This can be achieved by moving the stop loss to match the level of the SAR indicator.
Other Indicators that Complement Parabolic SAR
Wilder recommended using other indicators like the average directional index momentum indicatorADX Indicator - Technical AnalysisADX stands for average directional movement index. The ADX indicator is an indicator of trend strength, commonly used in futures trading. However, it has since been widely applied by technical analysts to virtually every other tradeable investment, from stocks to forex to ETFs. to confirm the strength of the existing trend. Other indicators that complement the SAR trading signals include moving averages and candlestick patterns.
For example, when the asset price falls below a long-term moving average, it confirms the sell signal that is produced by the Parabolic SAR. If the price is above the moving average, focus on taking the buy signals.
How to Calculate the SAR Indicator
The Parabolic SAR uses the highest and lowest price as well as the acceleration factor to determine where the SAR indicator dot will be displayed. The formula for the Parabolic SAR is as follows:
Uptrend Parabolic SAR = Prior SAR + Prior AF (Prior EP – Prior SAR)
Downtrend Parabolic SAR = Prior SAR – Prior AF (Prior SAR – Prior EP)
Where:
- EP is the extreme point in a trend (highest point reached by a price during an uptrend or the lowest price reached during a downtrend).
- AF is the acceleration factor which is initially set to a value of 0.02 (it is increased by 0.02 each time the EP is recorded, with a maximum of 0.20). Traders can choose the acceleration factor depending on the tradings style or instrument being traded).
Results obtained from the calculations above create a dot that is plotted against the asset price action, either below or above it. The dots help to determine the current direction of the price.
Pros and Cons of the Parabolic
The benefit of using a Parabolic SAR is that it helps to determine the direction of price action. In a strong trending environment, the indicator produces good results. Also, when there is a move against the trend, the indicator gives an exit signal when a price reversal could occur. This tool works best in trending markets with long rallies or declines.
On the downside, the Parabolic SAR produces false signals when the price action starts moving sideways. Due to the lack of a trend, the indicator will move back and forth around the price bar, and this produces misleading signals. When a trader solely relies on the Parabolic SAR during sideways market conditions, it can result in losing trades.
To prevent such mishaps, traders should only trade in the direction of the dominant trend and avoid trades when a trend is absent. Also, using other indicators like moving averages alongside parabolic SAR can help prevent such losses.
More Resources
CFI is the official provider of the global Financial Modeling & Valuation Analyst (FMVA)™Become a Certified Financial Modeling & Valuation Analyst (FMVA)®CFI's Financial Modeling and Valuation Analyst (FMVA)® certification will help you gain the confidence you need in your finance career. Enroll today! certification program, designed to help anyone become a world-class financial analyst. To keep advancing your career, the additional resources below will be useful:
- How to Read Stock ChartsHow to Read Stock ChartsIf you’re going to actively trade stocks as a stock market investor, then you need to know how to read stock charts. Even traders who primarily use fundamental analysis to select stocks to invest in still often use technical analysis of stock price movement to determine specific buy and sell, stock charting
- MACD Oscillator – Technical AnalysisMACD Oscillator - Technical AnalysisThe MACD Oscillator is used to examine short-term moving average convergence and divergence. The MACD Oscillator is a double-edged technical indicator in that it offers traders and analysts the ability to follow trends in the market, as well as gauge the momentum of price changes.
- Momentum InvestingMomentum InvestingMomentum investing is an investment strategy aimed at purchasing securities that have been showing an upward price trend or short-selling securities that
- Relative Strength Indicator (RSI)Relative Strength Index (RSI)The Relative Strength Index (RSI) is one of the most popular and widely used momentum oscillators. It was originally developed by the famed mechanical engineer turned technical analyst, J. Welles Wilder. The RSI measures both the speed and rate of change in price
-

Understanding Delta: A Key Risk Measure in Derivatives
Delta is a risk sensitivity measure used in assessing derivativesDerivativesDerivatives are financial contracts whose value is linked to the value of an underlying asset. They are complex financial in
-
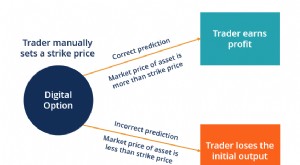
Understanding Digital Options: A Comprehensive Guide for Traders
A digital option is a form of option that allows traders to manually set a strike price. The digital option provides the traders with a fixed payout in the case when the market price of the underlying
invest
- Understanding Divergence in Technical Analysis: A Guide
- Understanding Forward Prices: Definition & How They Work
- Understanding Hedging Strategies: A Comprehensive Guide
- Understanding Slippage in Trading: Causes & Impact
- Understanding Strangle Options: A Comprehensive Guide
- Understanding Volatility: A Key Indicator of Investment Risk
- Price Discrimination Explained: Types, Examples & Strategies
- What is Price Fixing?
- Price Skimming: Definition, Strategy & When to Use It
-
 Covered Calls: A Comprehensive Guide for Investors
A covered call is a risk management and an options strategy that involves holding a long position in the underlying asset (e.g., stockStockWhat is a stock? An individual who owns stock in a company is...
-
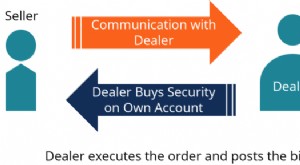 Understanding Dealer Markets: How Market Makers Function
A dealer market is a financial market where dealers post prices they would be willing to buy and sell specific securitiesTrading SecuritiesTrading securities are securities purchased by a company for ...