Understanding the Credit-Market Debt to Income Ratio
The credit-market debt to disposable income ratio is a financial metric used to measure financial conditions in householdsHouseholdA household refers to a social unit of people who live together under one roof and share resources, even if they are not related to each other. In the US,. The ratio compares the total amount of debt held by households to the disposable income (after-tax income) of the households. The credit-market debt to disposable income ratio is also called the household debt to disposable income ratio.
Formula for the Credit-Market Debt to Disposable Income Ratio
Where:
- Credit-market Debt refers to the current value of all existing mortgage loan liabilitiesMortgageA mortgage is a loan – provided by a mortgage lender or a bank – that enables an individual to purchase a home. While it’s possible to take out loans to cover the entire cost of a home, it’s more common to secure a loan for about 80% of the home’s value., household lines of credit, and non-mortgage loan liabilities by all households.
- Disposable Income refers to the after-tax income earned by all households.
Practical Example
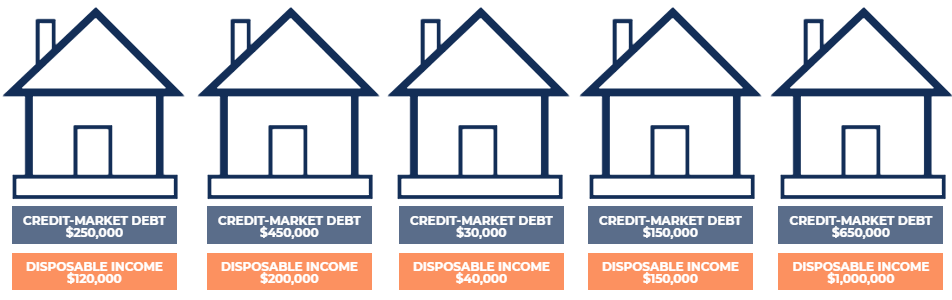
There are five households in Country A. Each household’s credit-market debt and disposable income are shown below. What is the credit-market debt to disposable income for Country A?
To determine the credit-market debt to disposable income ratio for Country A, we add the credit-market debt across all households and divide it by the sum of disposable income across all households. The calculations are shown below:
Total Credit-Market Debt = $250,000 + $450,000 + $30,000 + $150,000 + $650,000 = $1,530,000
Total Disposable Income = $120,000 + $200,000 + $40,000 + $150,000 + $1,000,000 = $1,510,000
Credit-Market Debt to Disposable income Ratio = $1,530,000 / $1,510,000 x 100 = 101.32%
How to Interpret
The credit-market debt to disposable income ratio measures the ability of households to manage their existing debt from their disposable income. The ratio can be interpreted as the dollar amount of credit market debt per dollar of household disposable income. In the example above, households in Country A carry a credit market debt of $1.01 per dollar of disposable income.
A higher ratio is often seen as undesirable and risky. The higher the ratio, the more susceptible households are to adverse changes in economic conditions. To illustrate the fact, consider the two scenarios below:
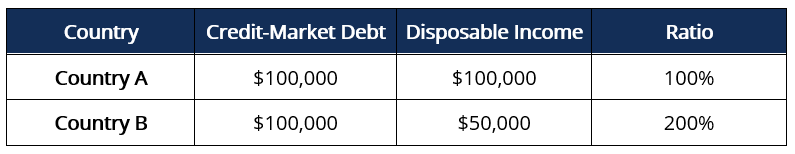
For simplicity, assume that debt in both countries bears a 5% annual interest rateEffective Annual Interest RateThe Effective Annual Interest Rate (EAR) is the interest rate that is adjusted for compounding over a given period. Simply put, the effective on the total outstanding credit-market debt and that all households in both countries are homogenous. As such, households in Country B would face a greater credit risk as they would see a relatively lower disposable income to service their interest payments.
The increased interest payment burden may cause households to (1) reduce consumptionConsumptionConsumption is defined as the use of goods and services by a household. It is a component in the calculation of the Gross Domestic Product and spending, (2) decrease their savings, or (3) lower their principal repayment amount. This would result in an adverse impact on the economy, as reduced consumption and spending would slow down the economy.
In the backdrop of increasing interest rates, a high ratio is concerning to see – the increasing interest rates may push households to default on their debt. Therefore, policymakers pay close attention to the ratio when setting interest rate policies.
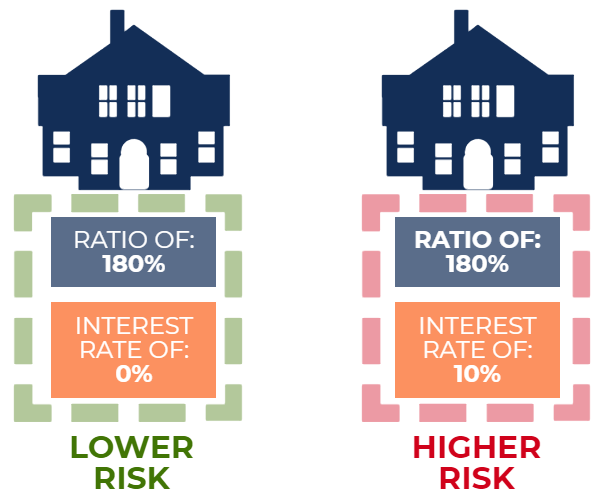
To conclude, the ratio is a measure of the relative financial vulnerability of households. A higher ratio indicates higher household credit risk, while a lower ratio indicates lower household credit risk. The ratio must be taken into consideration with current macroeconomic conditions to determine whether the ratio is concerning or not.
For example, a country with a ratio of 180% with a 0% interest rate environment would be significantly less worrying than another country with a ratio of 180% but in a 10% interest rate environment.
Additional Resources
CFI is the official provider of the Financial Modeling and Valuation Analyst (FMVA)™Become a Certified Financial Modeling & Valuation Analyst (FMVA)®CFI's Financial Modeling and Valuation Analyst (FMVA)® certification will help you gain the confidence you need in your finance career. Enroll today! certification program, designed to transform anyone into a world-class financial analyst.
To keep learning and developing your knowledge of financial analysis, we highly recommend the additional CFI resources below:
- Consumer Surplus FormulaConsumer Surplus FormulaConsumer surplus is an economic measurement to calculate the benefit (i.e., surplus) of what consumers are willing to pay for a good or
- Economic IndicatorsEconomic IndicatorsAn economic indicator is a metric used to assess, measure, and evaluate the overall state of health of the macroeconomy. Economic indicators
- Gross Domestic Product (GDP)Gross Domestic Product (GDP)Gross domestic product (GDP) is a standard measure of a country’s economic health and an indicator of its standard of living. Also, GDP can be used to compare the productivity levels between different countries.
- Purchasing Power ParityPurchasing Power ParityThe concept of Purchasing Power Parity (PPP) is a tool used to make multilateral comparisons between the national incomes and living standards
-

Understanding Debt-to-Income Ratio (DTI): A Comprehensive Guide
The debt-to-income (DTI) ratio is a metric used by creditors to determine the ability of a borrower to pay their debts and make interest payments. The DTI ratio compares an individual’s monthly
-
Goodwill to Assets Ratio: Definition & Analysis
The goodwill to assets ratio measures the amount of goodwill a company has recorded on its books compared to its total assetsTypes of AssetsCommon types of assets include current, non-current, ph
finance
- Cash Flow to Debt Ratio: Understanding and Calculation
- Coverage Ratio: Understanding Your Company's Debt Repayment Ability
- Current Ratio: Definition, Calculation & Financial Health
- Debt Service Coverage Ratio (DSCR): Definition & Calculation
- Debt-to-Asset Ratio: Definition, Calculation & Significance
- Debt-to-Assets Ratio: Definition, Calculation & Risk Assessment
- Debt-to-Equity Ratio: Definition, Calculation & Importance
- Net Debt to EBITDA Ratio: Understanding Financial Leverage
- Operating Cash to Debt Ratio: Understanding Financial Health
-
 Asset Coverage Ratio: Understanding Financial Solvency
The asset coverage ratio is a financial metric that indicates how a company can potentially settle its debts by selling its tangible assetsTangible AssetsTangible assets are assets with a physical for...
-
 Understanding the CAPE Ratio: A Guide to Cyclically Adjusted P/E
The CAPE Ratio (also known as the Shiller P/E or PE 10 Ratio) is an acronym for the Cyclically-Adjusted Price-to-Earnings Ratio. The ratio is calculated by dividing a company’s stock price by th...