Net Debt to EBITDA Ratio: Understanding Financial Leverage
The net debt to earnings before interest, taxes, depreciation, and amortization (EBITDA) ratio measures financial leverageFinancial LeverageFinancial leverage refers to the amount of borrowed money used to purchase an asset with the expectation that the income from the new asset will exceed the cost of borrowing. and a company’s ability to pay off its debtSenior and Subordinated DebtIn order to understand senior and subordinated debt, we must first review the capital stack. Capital stack ranks the priority of different sources of financing. Senior and subordinated debt refer to their rank in a company's capital stack. In the event of a liquidation, senior debt is paid out first. Essentially, the net debt to EBITDA ratio (debt/EBITDA) gives an indication as to how long a company would need to operate at its current level to pay off all its debt. The ratio is commonly used by credit rating agenciesRating AgencyA rating agency assesses the financial strength of companies and government entities, especially their ability to meet principal and interest payments to determine the probability of a company defaulting on its debt.
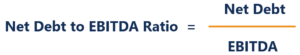
Formula
The Debt to EBITDA ratio formula is as follows:
Where:
- Net debt is calculated as short-term debt + long-term debt – cash and cash equivalents.
- EBITDAEBITDAEBITDA or Earnings Before Interest, Tax, Depreciation, Amortization is a company's profits before any of these net deductions are made. EBITDA focuses on the operating decisions of a business because it looks at the business’ profitability from core operations before the impact of capital structure. Formula, examples stands for earnings before interest, taxes, depreciation, and amortization.
Practical Example of EBITDA Ratio
For example, McDonald’s Corporation reported the following figures for the fiscal year ending December 31, 2016:
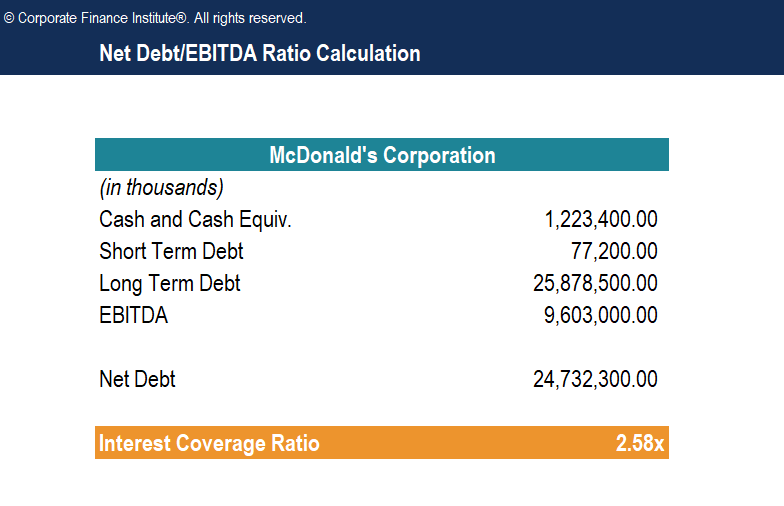
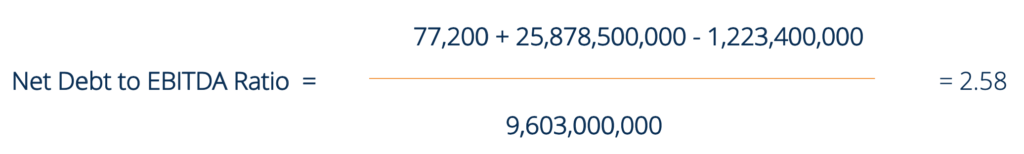
The Debt to EBITDA for McDonald’s is calculated as follows:
Download the Free Template
Enter your name and email in the form below and download the free net deb to EBITDA ratio template now!
Interpretation
A low net debt to EBITDA ratio is generally preferred by analysts, as it indicates that a company is not excessively indebted and should be able to repay its debt obligations. Conversely, if the net debt to EBITDA ratio is high, it indicates that a company is heavily burdened with debt. That situation would lower the company’s credit rating and investors would, therefore, require higher yields on bonds to compensate for the higher default risk. For McDonald’s Corporation, Standard & Poor’s (S&P) assigned a credit rating of BBB+, Moody’s assigned a credit rating of Baa1, and Fitch assigned a credit rating of BBB:
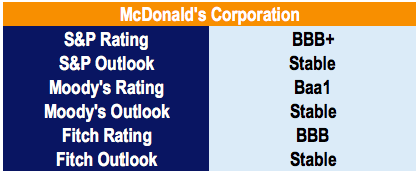
Source: Information compiled on Capital IQCapIQCapIQ (short for Capital IQ) is a market intelligence platform designed by Standard & Poor’s (S&P). The platform is widely used in many areas of corporate finance, including investment banking, equity research, asset management and more. The Capital IQ platform provides research, data, and analysis on private, public in 2018.
Generally, a net debt to EBITDA ratio above 4 or 5 is considered high and is seen as a red flag that causes concern for rating agencies, investors, creditors, and analysts. However, the ratio varies significantly between industries, as each industry differs greatly in capital requirements. As a result, it is best used to compare companies in the same industry. In a loan agreement between a company and a lender, the lender often requires the company to remain below a certain net debt to EBITDA ratio.
Key Takeaways
- The net debt to EBITDA ratio measures a company’s ability to pay off debt with EBITDAEBITDAEBITDA or Earnings Before Interest, Tax, Depreciation, Amortization is a company's profits before any of these net deductions are made. EBITDA focuses on the operating decisions of a business because it looks at the business’ profitability from core operations before the impact of capital structure. Formula, examples.
- The ratio is commonly used by credit rating agenciesRating AgencyA rating agency assesses the financial strength of companies and government entities, especially their ability to meet principal and interest payments to assign a credit rating to a company.
- A low ratio is preferred and indicates that the company is not excessively indebted.
- A high ratio indicates that the company has high debt levels, and may, consequently, result in a lower credit rating (therefore mandating the company offer higher yields on bonds).
- An ideal debt to EBITDA ratio depends heavily on the industry, as industries vary greatly in terms of average capital requirements. However, a ratio of greater than 5 is usually a cause for concern.
- To ensure that a company is able to repay debt obligations, loan agreements typically specify covenantsDebt CovenantsDebt covenants are restrictions that lenders (creditors, debt holders, investors) put on lending agreements to limit the actions of the borrower (debtor). that dictate the range which a company’s net debt/EBITDA ratio can fall under.
Related Readings
Thank you for reading CFI’s explanation of the net debt to EBITDA ratio. CFI offers the Financial Modeling & Valuation Analyst (FMVA)™Become a Certified Financial Modeling & Valuation Analyst (FMVA)®CFI's Financial Modeling and Valuation Analyst (FMVA)® certification will help you gain the confidence you need in your finance career. Enroll today! certification program and other training for financial professionals. To learn more and expand your career, explore the additional relevant CFI resources below.
- Leverage RatiosLeverage RatiosA leverage ratio indicates the level of debt incurred by a business entity against several other accounts in its balance sheet, income statement, or cash flow statement. Excel template
- Debt CovenantsDebt CovenantsDebt covenants are restrictions that lenders (creditors, debt holders, investors) put on lending agreements to limit the actions of the borrower (debtor).
- Analysis of Financial StatementsAnalysis of Financial StatementsHow to perform Analysis of Financial Statements. This guide will teach you to perform financial statement analysis of the income statement,
- Financial Modeling GuideFree Financial Modeling GuideThis financial modeling guide covers Excel tips and best practices on assumptions, drivers, forecasting, linking the three statements, DCF analysis, more
-

Advertising to Sales Ratio: Measuring Ad Effectiveness & ROI
The advertising to sales ratio, also called the “A to S” for short, measures the effectiveness, or how successful, a company’s advertising strategiesAIDA ModelThe AIDA model, which s
-
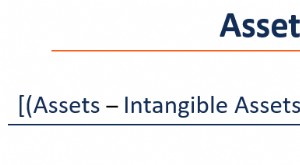
Asset Coverage Ratio: Understanding Financial Solvency
The asset coverage ratio is a financial metric that indicates how a company can potentially settle its debts by selling its tangible assetsTangible AssetsTangible assets are assets with a physical for
finance
- Cash Flow to Debt Ratio: Understanding and Calculation
- Coverage Ratio: Understanding Your Company's Debt Repayment Ability
- Understanding the Credit-Market Debt to Income Ratio
- Debt Service Coverage Ratio (DSCR): Definition & Calculation
- Debt-to-Asset Ratio: Definition, Calculation & Significance
- Debt-to-Assets Ratio: Definition, Calculation & Risk Assessment
- Debt-to-Equity Ratio: Definition, Calculation & Importance
- Net Debt to EBITDA Ratio: Understanding Company Solvency
- Operating Cash to Debt Ratio: Understanding Financial Health
-
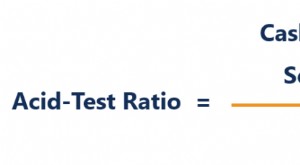 Acid-Test Ratio: Understanding Your Company's Short-Term Liquidity
The Acid-Test Ratio, also known as the quick ratioQuick RatioThe Quick Ratio, also known as the Acid-test, measures the ability of a business to pay its short-term liabilities with assets readily conv...
-
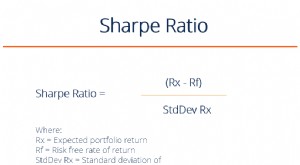 Sharpe Ratio: Calculate & Interpret Investment Performance
Named after American economist, William Sharpe, the Sharpe Ratio (or Sharpe Index or Modified Sharpe Ratio) is commonly used to gauge the performance of an investment by adjusting for its risk.The hig...